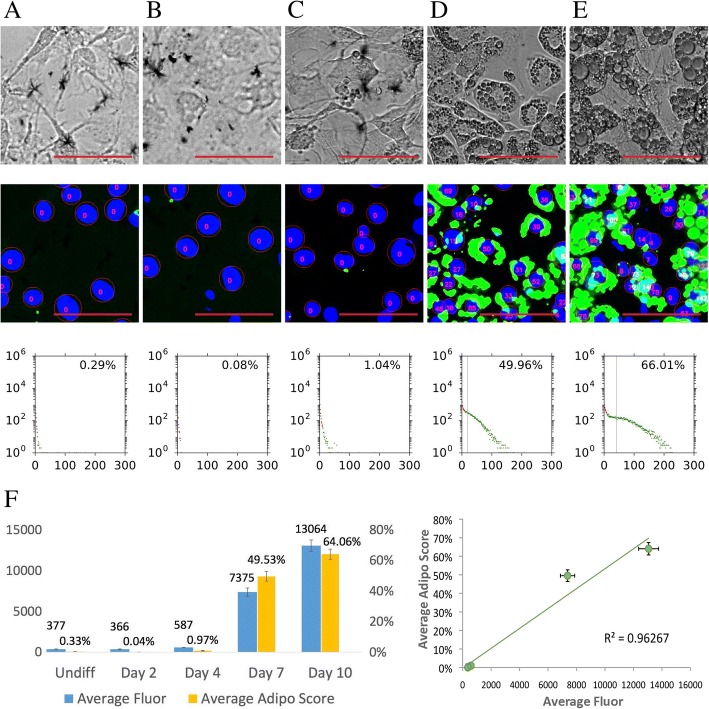
Fig. 3.
Time course assay of 3T3-L1 adipogenesis. The representative fields of phase-contrast (top row), nuclei and lipid droplets detection (middle row), and histograms from a whole well (bottom row) are shown for the five samples: undifferentiated (a), day 2 (b), day 4 (c), day 7 (d), and day 10 (e). Scale bars 100 μm. f The left graph shows average fluorescence measurements of Nile Red staining by spectroscopy (blue bars; left y-axis; n = 8) and average adipogenic scores (orange bars; right y-axis; n = 8–16) for each time points. The right graph indicates correlation between the spectroscopic fluorescence measurements (standard) and adipogenic scores (by FATS). Results are presented as mean ± standard error of mean (SEM)

