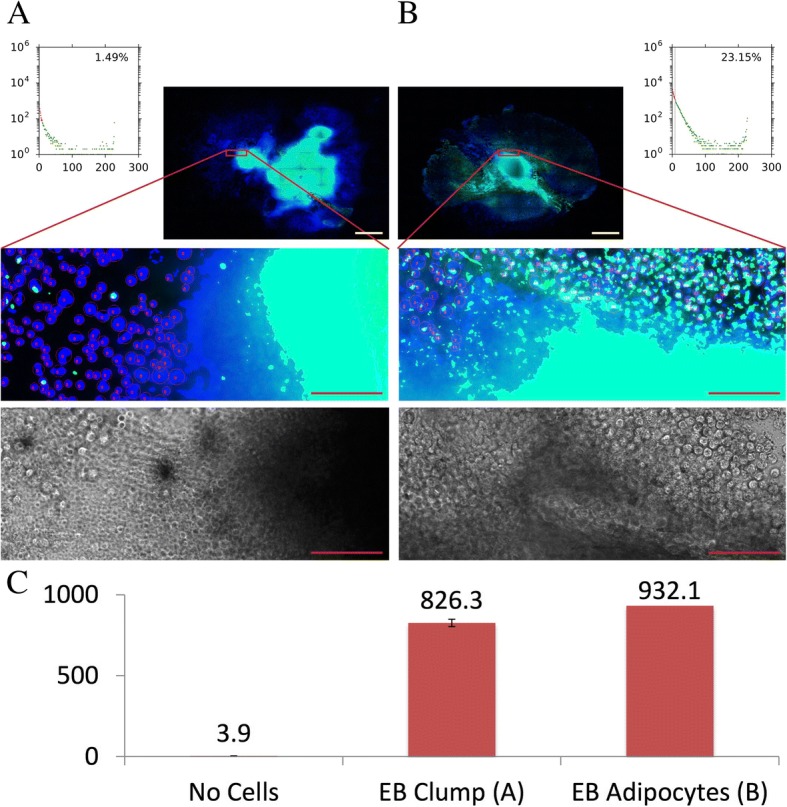
Fig. 6.

Improved accuracy of FATS analysis to estimate adipogenesis of EBs derived from pluripotent stem cells. An example of EB clump sample that is surrounded by non-differentiated fibroblastic cells spread out of EB and has little amount of differentiated adipocytes, yet adsorbs lipid droplets dye non-specifically (a). The FATS algorithm excludes such non-specific staining caused by cell clump, calculating an adipogenic score as 1.49%. The case of an EB sample that contains significant amount of differentiated adipocytes in the surrounding area gives rise to estimation of a good adipogenic score as 23.15% by FATS (b). This is in contrast to artificially high values of the EB clump sample (826.3) given by fluorescent spectroscopic reading (c). Red scale bars, 100 μm; yellow scale bars, 1 mm
