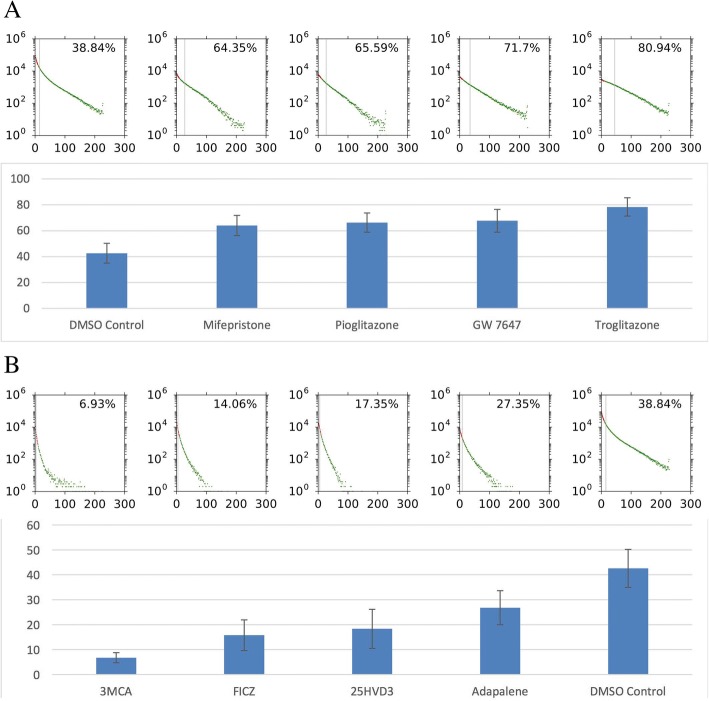
Fig. 7.
High-throughput screening assay of nuclear receptor ligands in 3T3-L1 cells analysed by FATS. Adipogenic scores for the top four samples (a) and the bottom four samples (b) are shown. Error bars are standard error of the mean (SEM) for n = 6 plates. Histograms indicate representative samples from a single plate

