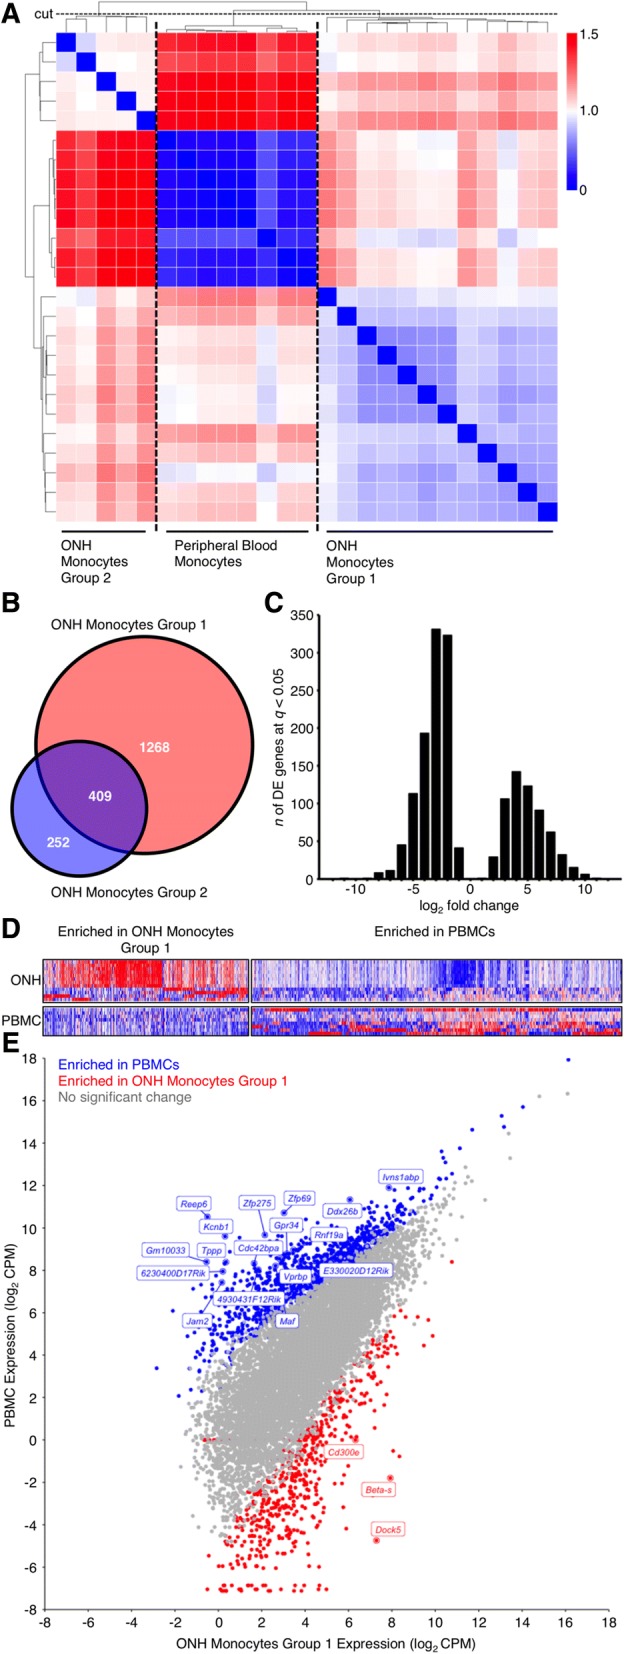
Fig. 1.

RNA-sequencing of monocytes in glaucoma. a Heatmap correlations of all samples (Spearman’s rho, blue = high correlation, red = lowest correlation). Dendrogram is shown in grey at top and left of heatmap. The cut-off to generate clusters on the dendrogram is shown as the horizontal dashed line labelled “cut”. Cutting strategy was defined as all control (peripheral blood monocytes; PBMC) samples falling into one group with the maximum number of total samples retained. b Venn diagram showing number of DE genes (FDR, q < 0.05) between ONH Monocytes Group 1 vs. PBMCs and ONH Monocytes Group 2 vs. PBMCs (red and blue), and shared DE genes between groups (purple). c Histogram of DE genes by fold change between ONH Monocytes Group 1 vs. PBMCs. d Heatmap showing all DE genes (x) by sample (y). Red = highly expressed, blue = lowly expressed. e Scatter plot showing all genes (dots, not DE = grey, DE and enriched in PBMCs = blue, DE and enriched in ONH Monocytes Group 1 = red). Top 20 DE genes are named
