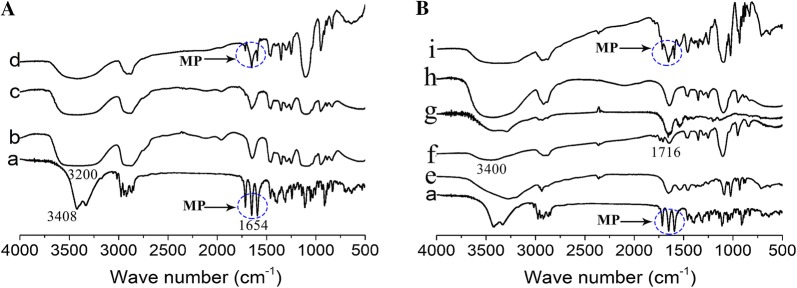
Fig. 2.
Fourier-transform infrared spectra of NPs. A Spectra of MP (trace a), PEG (trace b), MP-PEG (trace c), and the physical mixture of MP and PEG (trace d). Peaks at 3408, 1654 and 3200 cm−1 corresponded, respectively, to the free υO–H, conjugated υC=O and connective υO–H. B Spectra of MP (trace a), blank NPs (trace e), NHS-PEG5000-MAL (trace f), NEP1-40 (trace g), NEP1-40-MP-NPs (trace h), and the physical mixture of MP, NHS-PEG5000-MAL and NEP1-40 (trace i). Peaks at 1716 and 3400 cm−1 corresponded, respectively, to amino ester υC = O and connective υO–H

