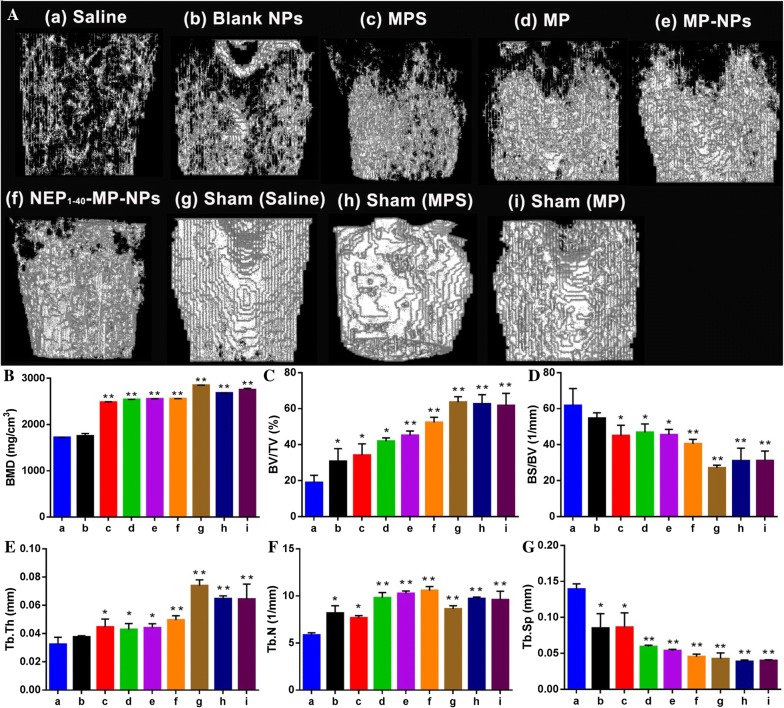
Fig. 9.
Effects of the different formulations on trabecular bone microarchitecture in rats after spinal cord injury. A Representative micro-computed tomographs after treatment with (a) saline, (b) blank NPs, (c) control MPS, (d) MP, (e) MP-NPs, (f) NEP1-40-MP-NPs, (g) saline sham, (h) MPS sham and (i) MP sham. B Bone mineral density (BMD). C Bone volume/total volume (BV/TV). D Bone surface area/bone volume (BS/BV). E Trabecular thickness (Tb.Th). F Trabecular number (Tb.N). G Trabecular spacing (Tb.Sp). *P < 0.05 or **P < 0.01 vs. saline. Data are mean ± SD (n = 3)

