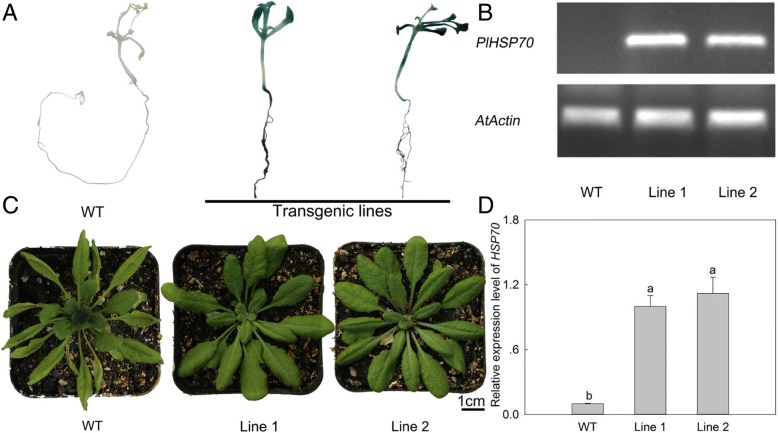
Fig. 5.
Identification of transgenic A. thaliana plants and their phenotype under high temperature stress. a GUS staining. b PCR analysis of PlHSP70 mRNA. c Phenotype of WT and transgenic lines. d Relative expression level of PlHSP70 in leaves. All data are the means of three replicates with standard deviations, and different letters indicate significant differences according to Duncan’s multiple range test (P < 0.05)

