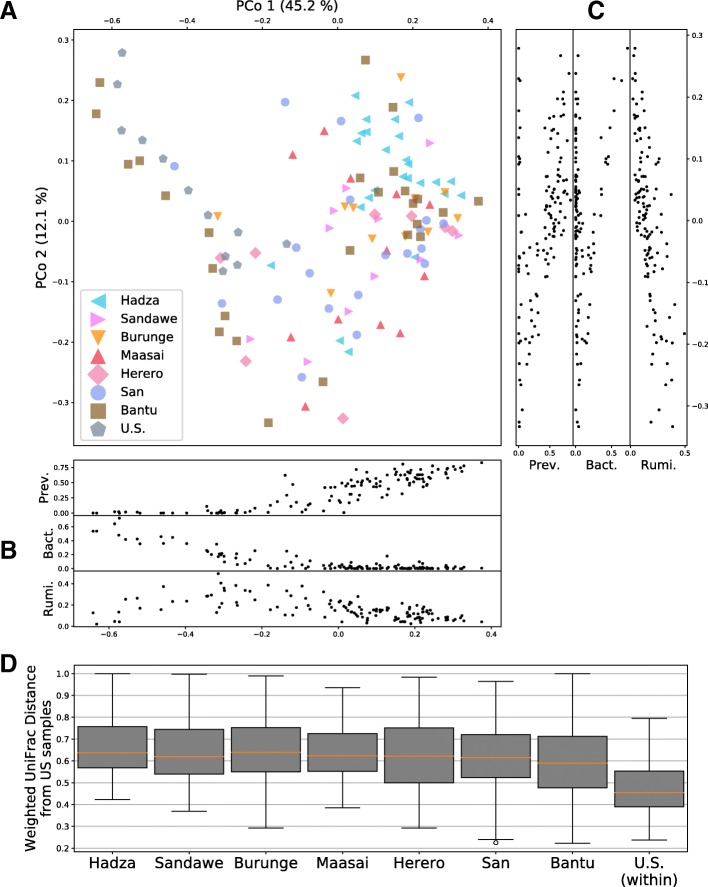
Fig. 5.
Principle coordinate analysis (PCoA) for weighted UniFrac distances. a The first two principle coordinates for all individuals in the study, where marker shape and color denote the population of origin. Sidebar (panels b and c) show the abundances of Prevotellaceae (Prev.), Bacteroidaceae (Bact.), and Ruminococcaceae (Rumi.) aligned to the first two principal coordinates. d Box-and-whisker distributions between each African population and the US samples, over all pairs of individuals

