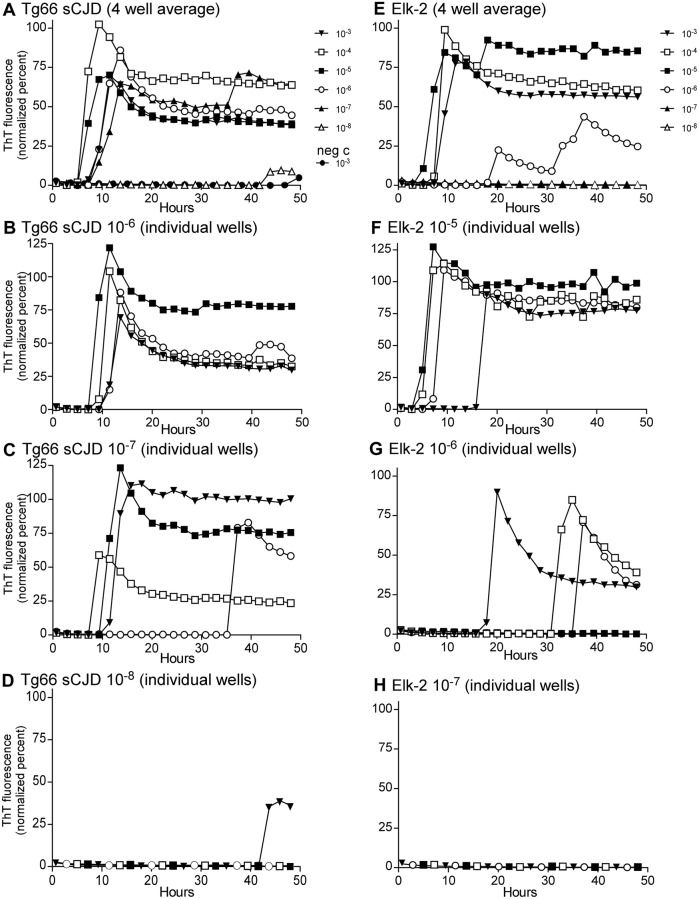
Figure 2.
RT-QuIC analysis for PrP amyloid seeding activity in brains from sCJD-infected tg66 mice or CWD-positive elk brain. A–D The sCJD-infected tg66 brain (B946-1) and panels E-H show the CWD-positive elk brain pool (Elk-2). In A and E, a ten-fold dilution series is shown. In these panels, each curve represents and average fluorescence of four replicate wells per dilution. Dilutions are indicated to the right of each panel. B–D and F–H Detailed data from individual dilutions (indicated in the panel titles). In these panels, four wells were tested at each dilution and each curve represents data from an individual well. Note how the ratio of wells with amyloid seeding activity decreases at the sample becomes more dilute (for example, compare F–H). For all the data shown, RT-QuIC was performed using Ha rPrP 90–231 substrate.

