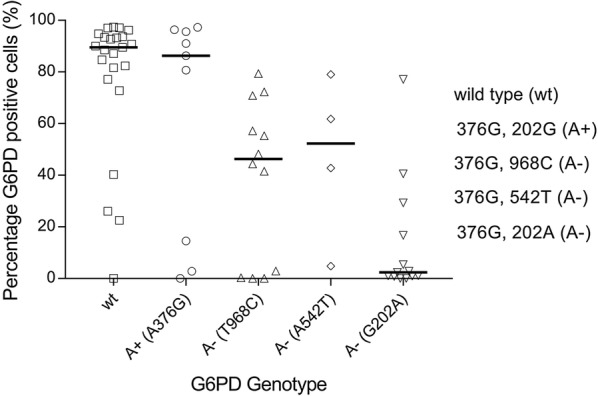
Fig. 3.

Percentage G6PD positive cells by flow cytometry by G6PD genotype. The % G6PD positive cells assessed by FACS was plotted against G6PD genotype generated by magnetic bead-based multiplex assay and KASP assay; wild type (wt, 202G and 376A), A+ (202G and 276G), A− (202A and 376G), A− (202A and 542TG) and A− (202A and 968C). The black horizontal line represents the median. The % G6PD positive cells were calculated using FlowJo version 10 Super-Enhanced Dmax Subtraction (SED) algorithm
