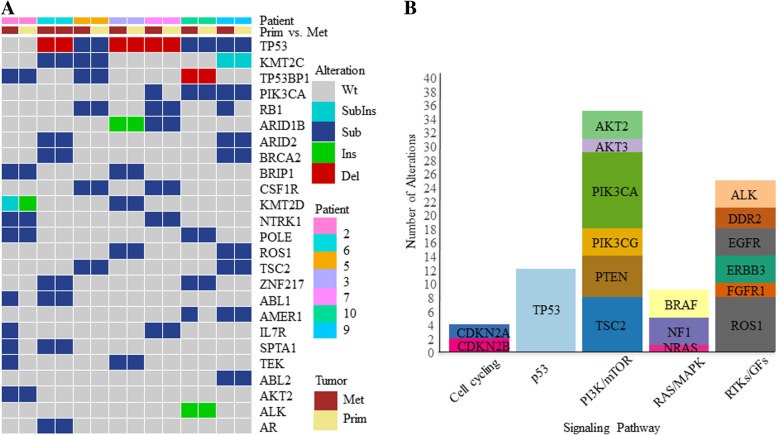
Fig. 1.
Genomic profiling of the “Pilot-TNBC” cohort. a Tile plot illustrating patients (columns) ordered by primary/metastatic status and by mutation frequency for the top 25 mutated genes; b Stacked bar plot illustrates the frequency of mutations observed in specific cellular signaling pathways: cell cycling, p53, PI3K/mTOR, RAS/MAPK, and RTK/GF signaling pathways [29]. Variants of unknown significance (VUS) were included for these analyses. Wt, wild type; SubIns, substitution and insertion; Sub, substitution; Ins, insertion; Del, deletion, Met, metastatic tumor; Prim, primary tumor

