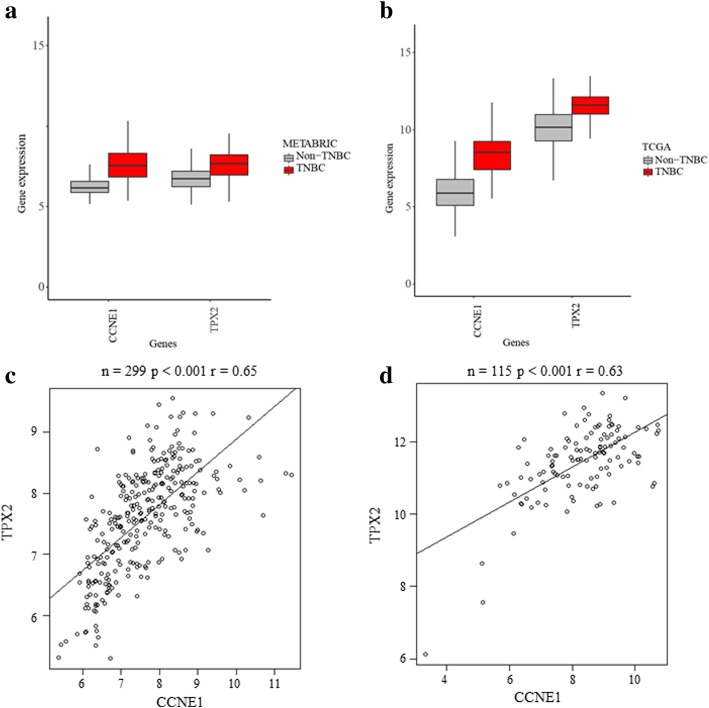
Fig. 3.
TNBCs exhibited higher mRNA expression of CCNE1 and TPX2 compared with non-TNBCs (Wilcoxon signed rank test) in (a) METABRIC: TNBC (n = 299) and non-TNBC (n = 1605) (p < 0.0001 for both CCNE1 and TPX2) and in (b) TCGA: TNBC (n = 115) and non-TNBC (n = 976) (p < 0.0001 for both CCNE1 and TPX2), y-axis is the log2 of TPM values by RSEM. In TNBCs, CCNE1 is significantly co-overexpressed with TPX2 in (c) METABRIC: TNBC (n = 299, p < 0.001, r = 0.65) and in (d) TCGA: TNBC (n = 115, p < 0.001, r = 0.63)

