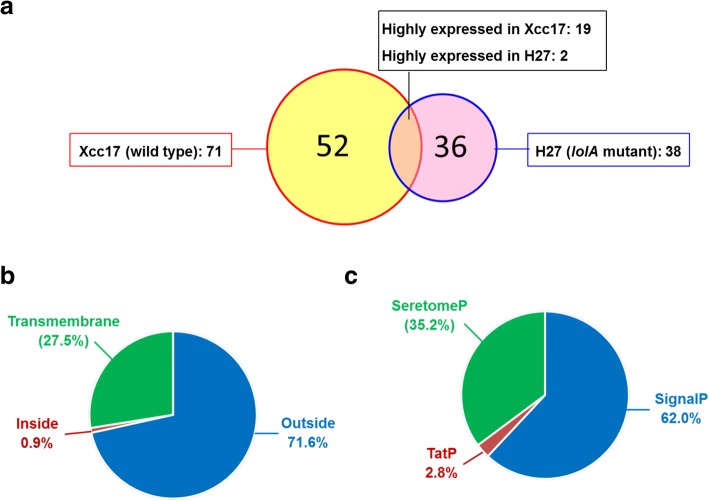
Fig. 6.
Differentially expressed proteins identified through proteomic analysis. Venn diagram (a) presents the numbers of differentially expressed proteins found in Xcc17 (wild type, red circle) and H27 (lolA mutant, blue circle). Pie chart (b) presents the protein location predicted using TMHMM. Pie chart (c) presents the signal peptide predicted by SignalP, SecretomeP, and TatP. Detailed information concerning differentially expressed proteins that were identified can be found in Additional file 2: Table S3

