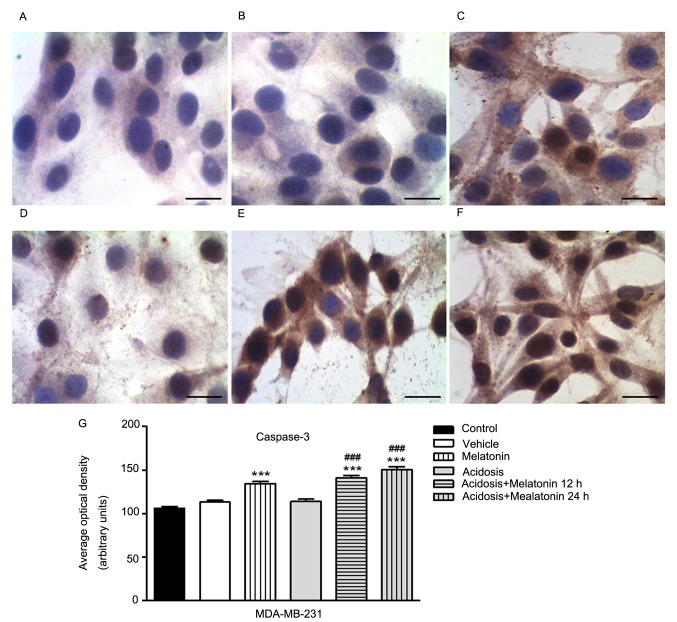
Figure 7.
Analysis of Caspase-3 (cleaved) expression in MDA-MB-231 cells. (A) Control group (pH 7.2). (B) Cells treated with vehicle only. (C) Post-treatment with melatonin (1 mM) for 24 h decreases the expression of Caspase-3. (D) Cells under acidosis (pH 6.7) have increased expression of Caspase-3. (E) Cells exposed to the pH 6.7 and treated concomitantly with melatonin (1 mM) for 24 h. (F) Cells exposed to the pH 6.7 treated with melatonin (1 mM) for 12 h. Scale bar=10 µm. Magnification, ×40. (G) Densitometric analysis of the expression of Caspase-3. Results were obtained as mean ± SEM densitometric index of three independent experiments done in triplicate. ***P<0.001 vs. control; ###P<0.001 vs. acidosis. SEM, standard error of the mean.

