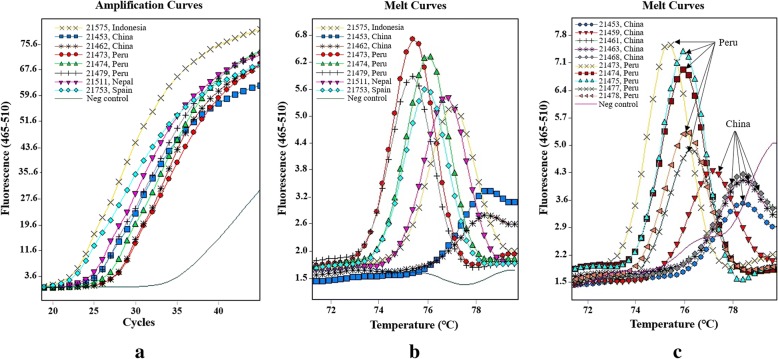
Fig. 1.
Amplification curves and melting curves of mitochondrial qPCR for Cyclospora cayetanensis. a Mitochondrial qPCR amplification curves of eight specimens from five countries. b Mitochondrial qPCR melt curves of eight specimens from five countries. c Mitochondrial qPCR melt curves of the specimens from China and Peru

