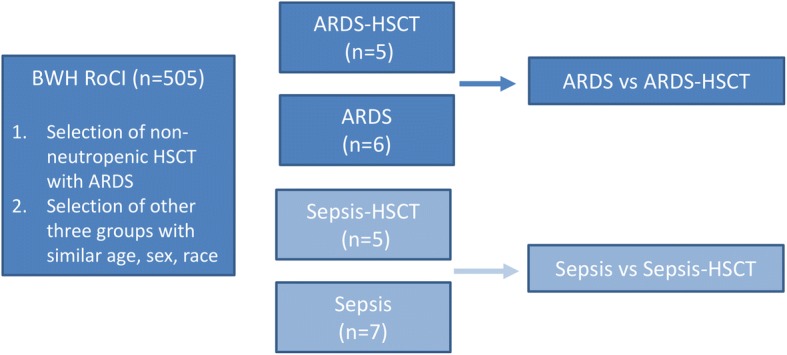
Fig. 1.

Schematic diagram of the experimental design. The primary analysis compared transcriptomic profiles of patients with ARDS compared to ARDS-HSCT (dark blue). In order to identify differences that were due to HSCT status, transcripts that were differentially regulated in sepsis patients compared to sepsis-HSCT (light blue) were excluded from the analysis
