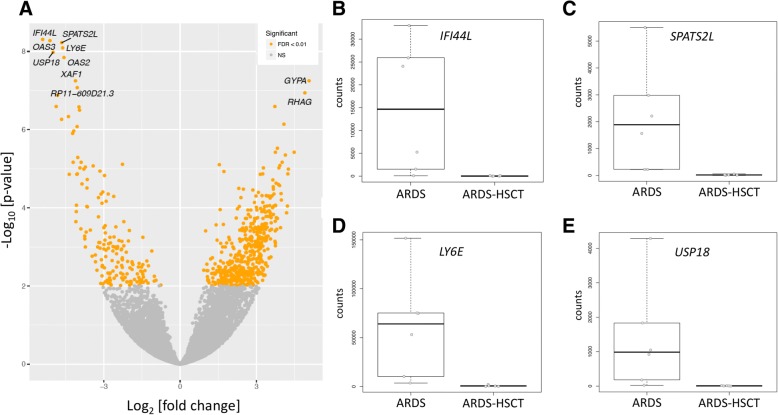
Fig. 2.
Results of differential expression analysis. a) Volcano plot of overall gene-based differential expression results of subjects with ARDS vs ARDS-SCT. The x-axis corresponds to the log (base 2) of the fold change difference between groups and the y-axis corresponds to the negative log (base 10) of the p-values. There were 687 differentially expressed genes (yellow dots) when using an adjusted p-value < 0.01. b-e) Boxplots of several of the most differentially expressed transcripts

