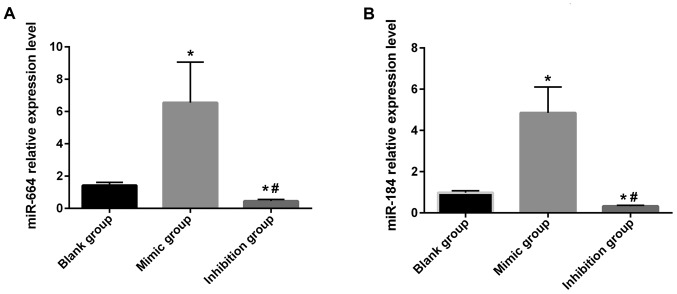
Figure 2.
(A) The expression of miR-664 in each group after transfection. The relative expression of miR-664 in each group after transfection is detected via RT-qPCR. Results manifest that there are differences in the relative expression level of miR-664 after transfection among the groups (F=15.146, P=0.005); the relative expression level of miR-664 in miR-664 inhibitor group is significantly lower than those in the blank and mimic groups, with statistically significant differences (inhibitor group vs. mimic group: t=8.106, P=0.001. Inhibitor group vs. blank group: t=4.192, P=0.014), and it is lower in the miR-664 blank group than that in the miR-664 mimic group (t=3.519, P=0.025). *P<0.05, there is a difference compared with the blank group. #P<0.05, there is a difference compared with the mimic group. (B) The expression of miR-184 in each group after transfection. The relative expression of miR-184 in each group after transfection is detected via RT-qPCR. Results display that there are differences in the relative expression level of miR-184 after transfection among groups (F=33.926, P=0.001), the relative expression of miR-184 in the miR-184 inhibitor group is obviously lower than that in the blank and mimic groups, with statistically significant differences (inhibitor group vs. mimic group: t=10.724, P=0.001. Inhibitor group vs. blank group: t=6.243, P=0.003), and it is lower in the miR-184 blank group than that in the miR-184 mimic group (t=5.322, P=0.006). *P<0.05, there is a difference compared with the blank group. #P<0.05, there is a difference compared with the mimic group.

