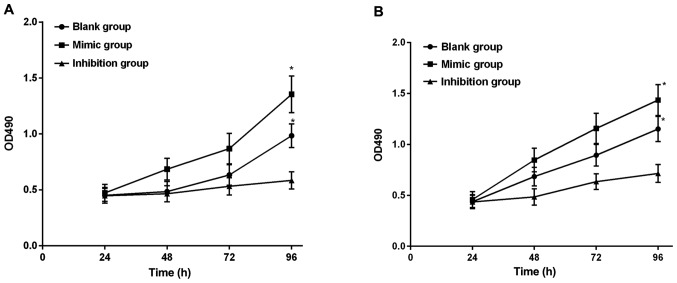
Figure 3.
(A) Cell proliferation capacities in the miR-664 groups after transfection. According to the detection of cell proliferation capacity via CCK-8 assay, there are no differences in the cell growth among the miR-664 groups within 24–72 h after cell transfection (P>0.05), but there are differences in the cell proliferation capacity among the miR-664 groups at 96 h (F=8.515, P=0.018). The cell growth shows no difference between the miR-664 mimic and blank groups (t=1.445, P=0.222), and it is obviously reduced in the miR-664 inhibitor group compared with that in the blank and mimic groups, with significant differences (inhibitor group vs. mimic group: t=4.094, P=0.015. Inhibitor group vs. blank group: t=2.868, P=0.046). *P<0.05, there is a difference compared with the mimic group. (B) Cell proliferation capacities in the miR-184 groups after transfection. The detection of cell proliferation capacity via CCK-8 assay shows that there are no differences in the cell growth among the miR-184 groups within 24–72 h after cell transfection (P>0.05), but there are differences in the cell proliferation capacity among miR-184 groups at 96 h (F=10.076, P=0.012). The cell growth shows no difference between the miR-184 mimic and blank groups (t=1.894, P=0.131), and it is obviously reduced in the miR-184 inhibitor group compared with that in the blank and mimic groups, with significant differences (inhibitor group vs. mimic group: t=4.247, P=0.013. Inhibitor group vs. blank group: t=3.044, P=0.038). *P<0.05, there is a difference compared with the mimic group.

