Figure 4.
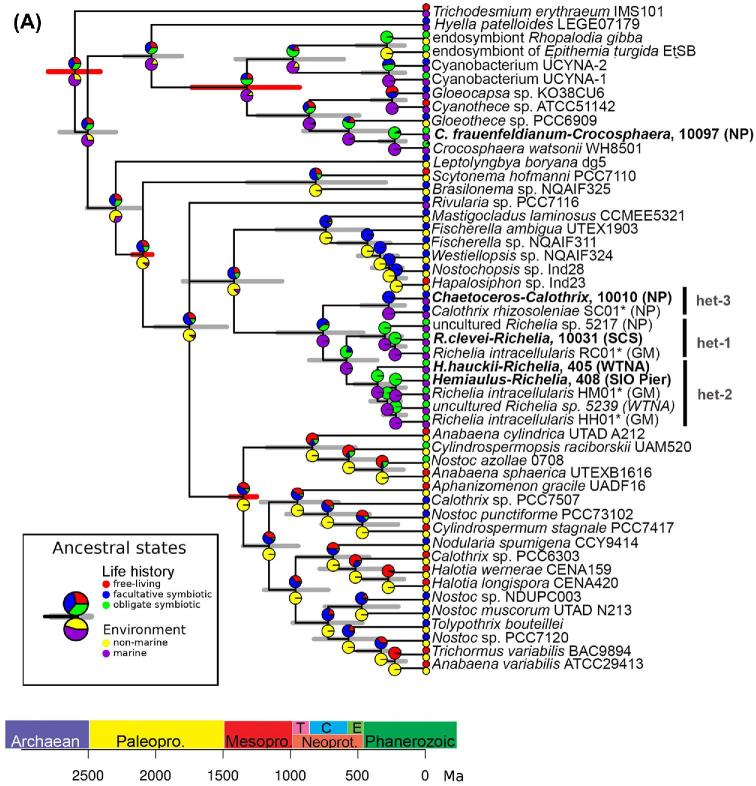
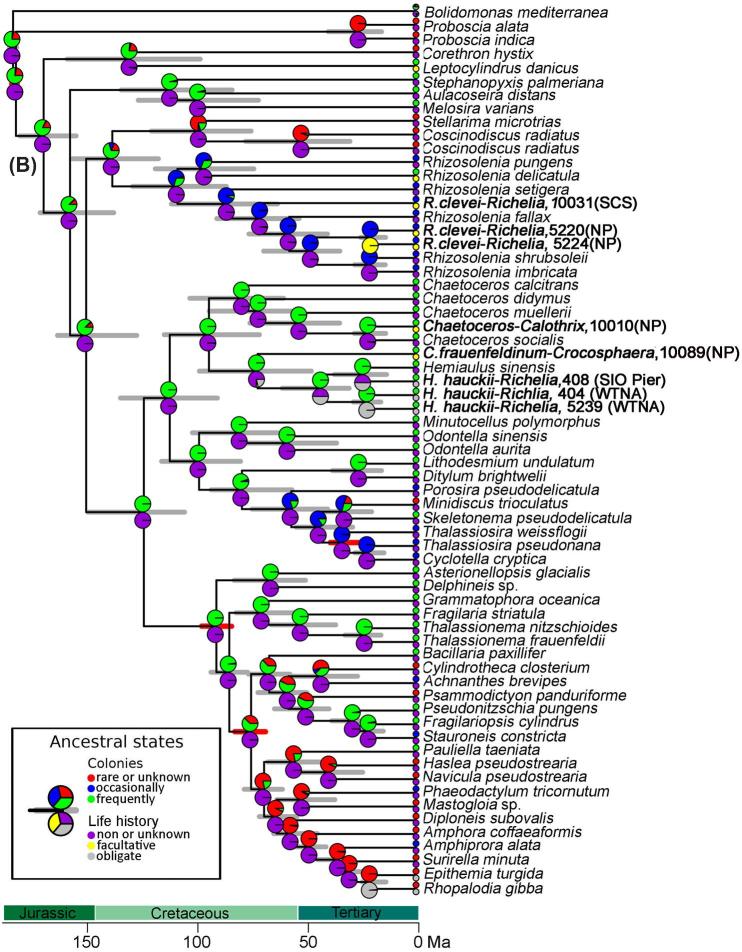
(A) Chronogram based on concatenated sequences (16S rRNA and nifH) depicting relationships among cyanobacteria taxa. Branch lengths are proportional to time (Mya). The 95% highest posterior density intervals for node ages are indicated by gray bars. Red bars indicate calibrated nodes defined in Table S4 (Supporting Information). Two characters are displayed: life history (upper pie-chart), and environment (lower pie-chart); the states assigned for each character are color-coded and shown in the figure legend. The small circles at the tips represent the observed data (present day); the pie-charts on the internal nodes are the probability distributions of the ancestral character state. The position of the circles (i.e. upper or lower) is consistent with the position of the pie-chart. Accession numbers for species in tree are provided in Table S3 (Supporting Information), and the sequences generated from our study are shown in bold.(B) Chronogram based on concatenated sequences (18S rRNA and rbcL) depicting relationships among diatom taxa. Branch lengths are proportional to time (Ma). The 95% highest posterior density intervals for node ages are indicated by gray bars. Red bars indicate calibrated nodes defined in Table S4 (Supporting Information). Two characters are displayed: colonies (upper pie-chart), and life history (lower pie-chart); the states assigned for each character are color-coded and shown in the figure legend. The small circles at the tips represent the observed data (present day); the pie-charts on the internal nodes are the probability distributions of the ancestral character state. The lower pie-charts at each node correspond to the lower circle at the tip (and vice-versa for the upper pie-charts). Accession numbers for species in tree are provided in Table S3 (Supporting Information), and sequences generated in our study are shown in bold.


