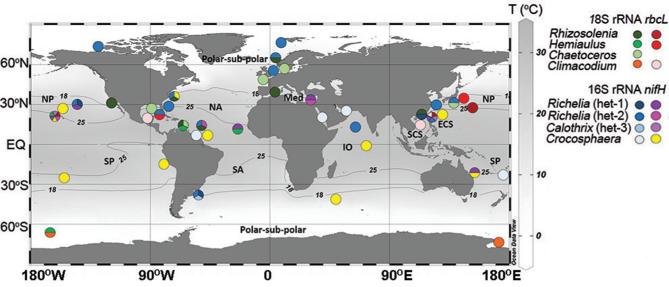
Figure 5.
Global distribution of sequences with similarity to DDA partners (sequence identity ≥ 98%; minimum coverage ≥ 350 bp). The host (18S rRNA, rbcL) and cyanobacterial sequences (nifH, 16S rRNA) generated in this study were used in BLASTn searches on NCBI, KEGG MGENES and IMNGS databases, and are color-coded. The presence of more than one sequence at the same geographic location is represented by a pie-chart. If only one sequence was retrieved, it is shown by a solid colored circle. The latitudinal 18°C and 25°C isotherms (average values of yearly means from the World Ocean Atlas 2013: NOAA’s National Oceanographic Data Center—Ocean Climate Laboratory) and ocean basin are designated.

