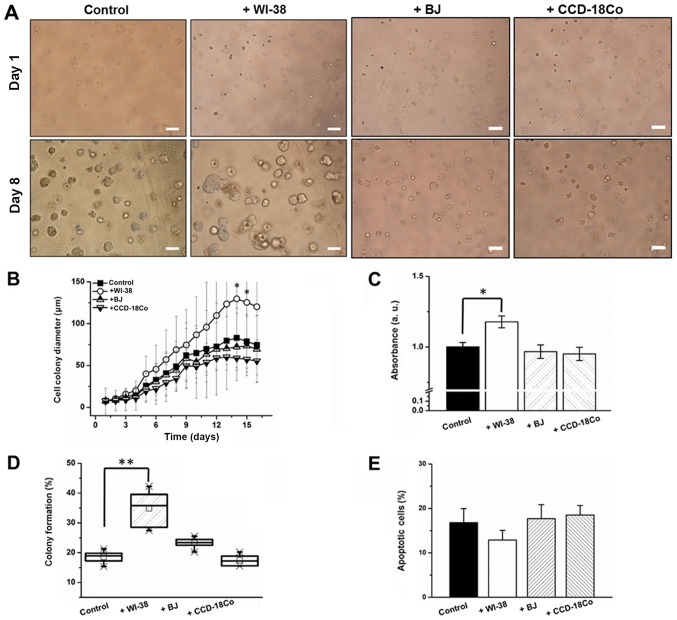
Figure 3.
Fibroblast co-culture effect on (A) colony morphology, (B) colony size, (C) cell proliferation, (D) percentage colony formation and (E) apoptotic rate of anchorage-independent SW480 cells. Error bars represent the standard deviation of three replicates. Scale bars, 50 µm. *P<0.05 and **P<0.01 vs. control/as indicated.

