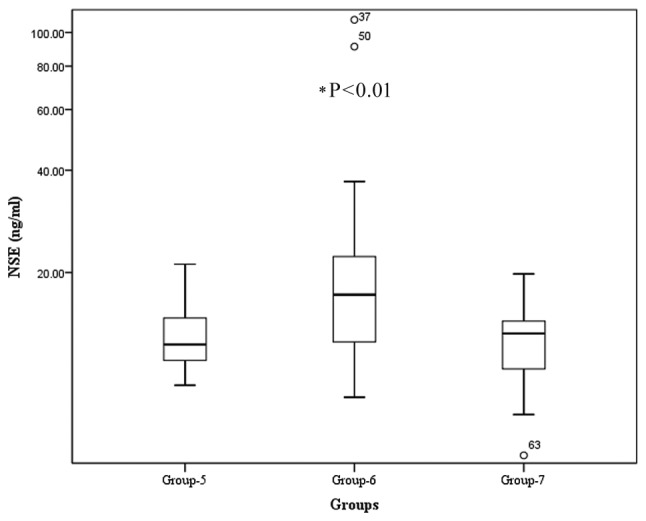
Figure 4.

Serum NSE levels in patients with gastroenteropancreatic neuroendocrine neoplasms and controls. Group 5, patients with no detectable lesions post-resection (n=18); Group 6, patients with naive or recurrent GEP-NENs (n=41); Group 7, healthy controls (n=30). There was a statistically significant difference between Group 6 and other two groups (Groups 5 and 7). *P<0.01 compared with other groups. NSE, neuron-specific enolase.
