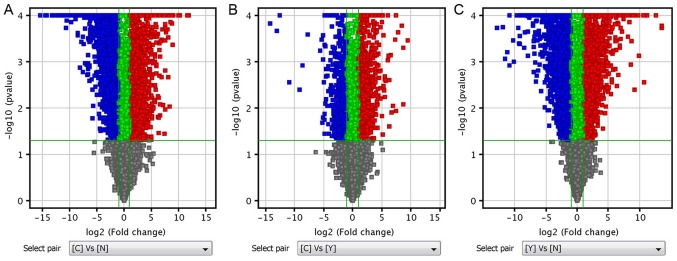
Figure 1.
Volcano plot analysis. (A) Volcano plot analysis of group C vs. N. (B) Volcano plot analysis of group C vs. Y. (C) Volcano plot analysis of group Y vs. N. The Volcano plots contain differentially expressed mRNAs and lncRNAs and indicate the full pictures of mRNAs and lncRNAs. The abscissa represents the difference between the two data sets following log2 conversion and the ordinate represents the -log10 (P-value) calculated by unpaired Student's t-test. Red dots represent significantly upregulated molecules, blue dots represent significantly downregulated molecules, green dots represent the molecules changed, but with a fold-change <2. N, normal gastric tissue samples; Y, primary gastrointestinal stromal tumor samples; C, imatinib mesylate-resistant gastrointestinal stromal tumor samples; lncRNA, long non-coding RNA.

