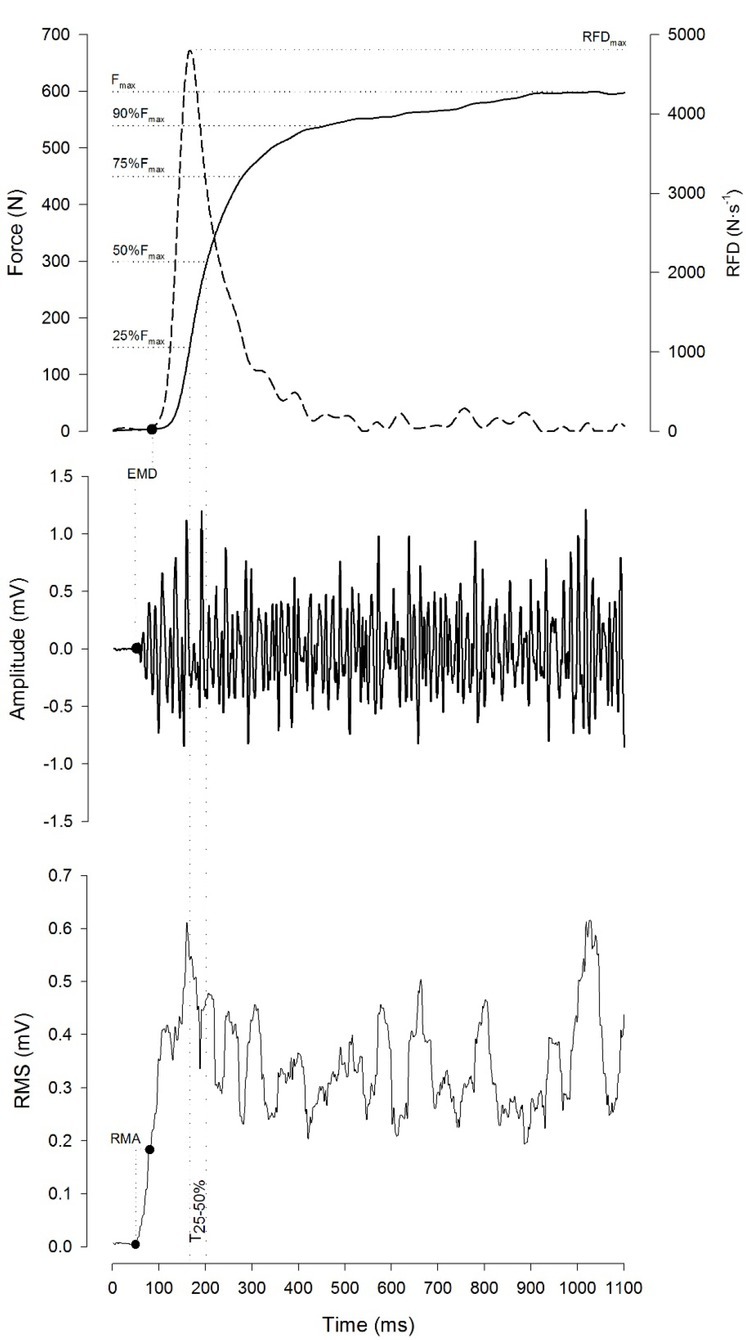
Figure 1.

An example of force–time and EMG–time curves recorded during a maximal voluntary contraction (MVC) with the “fast” instruction. Fmax: maximal voluntary force; RFDmax: maximal rate of force development; EMD: electromechanical delay; RMA: rate of muscle activity. The mean force output, elapsed time and RMS amplitude were calculated across five time intervals: between the force onset and achieving 25% of Fmax (T0-25%), between 25 and 50% of Fmax (T25-50%), between 50 and 75% of Fmax (T50-75%), between 75 and 90% of Fmax (T75-90%), and between 90% of Fmax and Fmax ( T90-100%).
