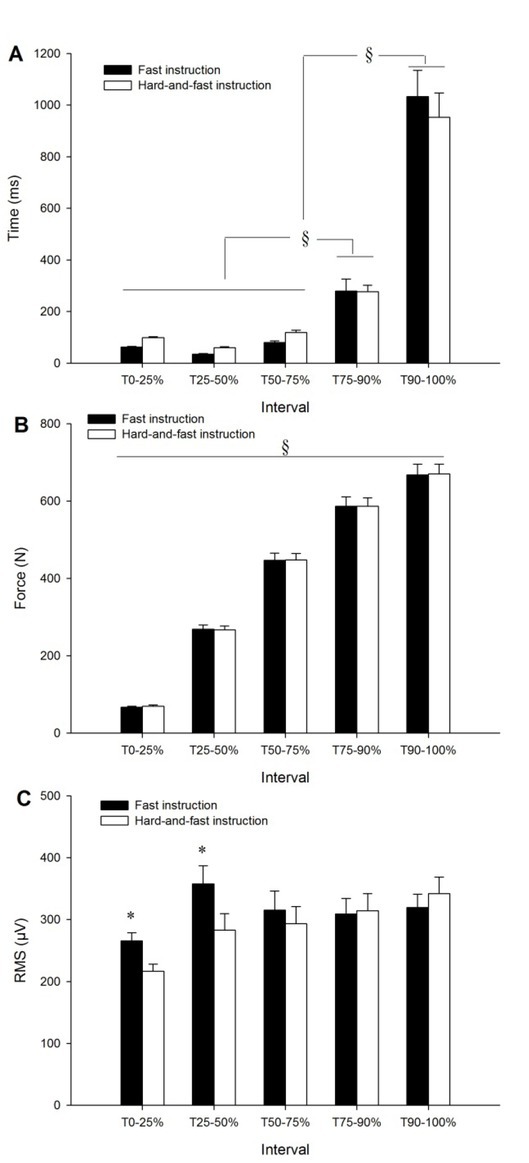
Figure 3.

Mean time (A), force production (B) and RMS amplitude (C) across the phases of force development from the contraction onset (T0) to Fmax (T100%). Data show mean ± SE of the two sessions. §: increased significantly among the different phases (p < 0.05). *: Significantly higher with the “fast” instruction compared to the “hard-and-fast” instruction (p < 0.001).
