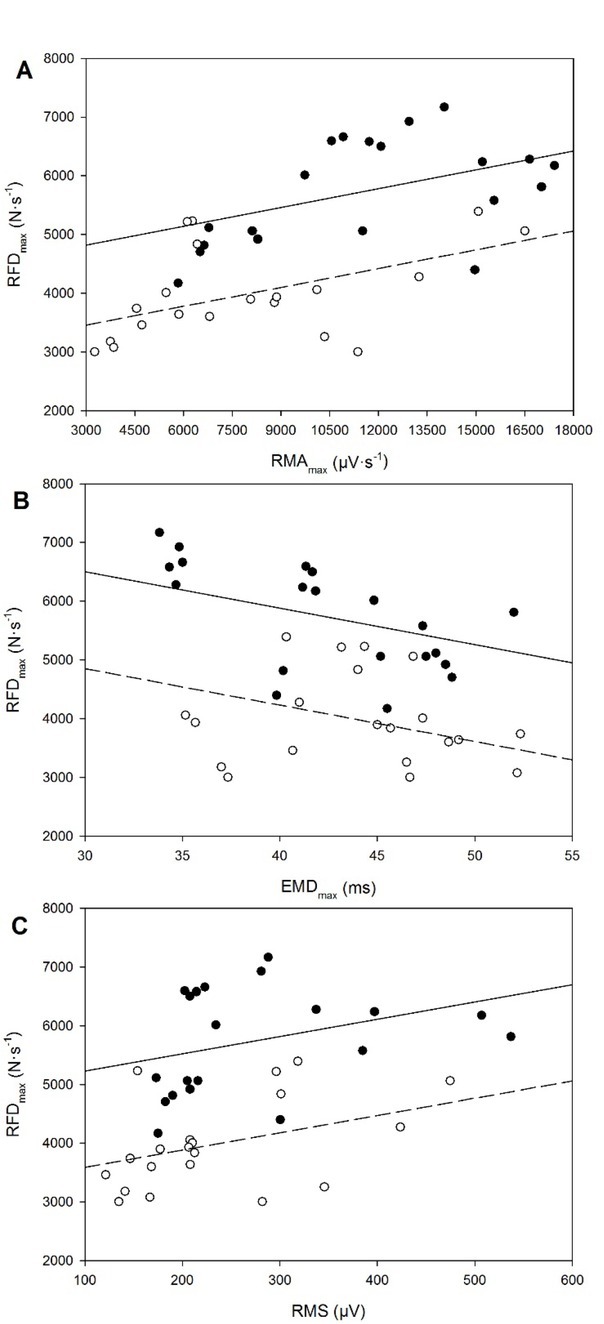
Figure 4.

Maximal rate of force development (RFDmax) plotted against the following variables: A, maximal rate of muscle activation (RMAmax); B, maximal electromechanical delay (EMDmax); and C, root mean square (RMS). A solid line and black symbols correspond to the “fast” instruction, whereas a dashed line and empty symbols correspond to the hard-and-fat instruction. Data are the mean of both sessions.
