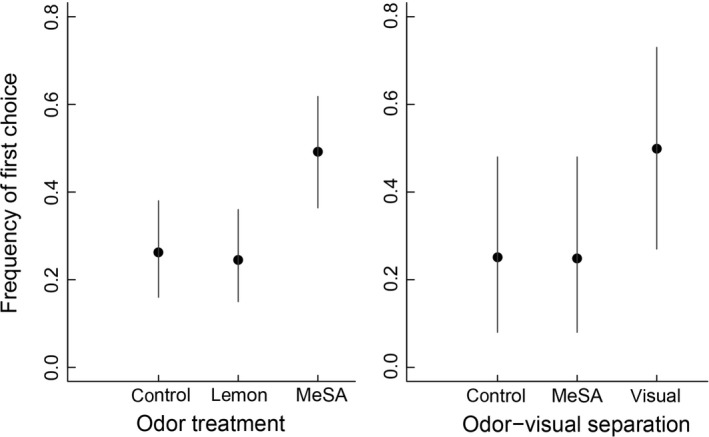
Figure 2.

Estimated frequency of foraging first choice for field experimental setups with visual information held constant and odor treatments varied (visible +hidden prey setups; left panel), and where odor (MeSA) and visual information were completely separated (right panel). Estimates are means with 95% Bayesian credible intervals. For separate estimates of the visible and hidden prey designs comprising the left panel, as well as between‐group differences, see Table 1
