
Figure 5.
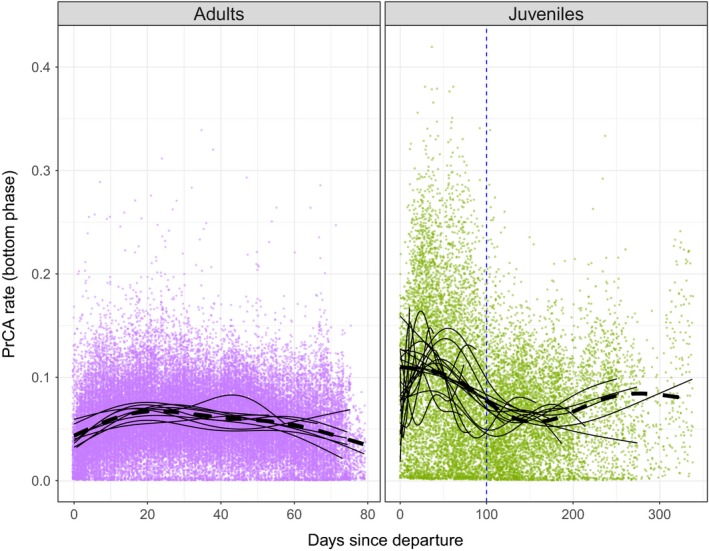
Comparison of changes in prey catch attempt (PrCA) over time for adult females (purple; left) and juveniles (green; right). Dashed lines indicate estimates from the fixed part of GAMMs and thin constant lines the individual random effects
Official websites use .gov
A
.gov website belongs to an official
government organization in the United States.
Secure .gov websites use HTTPS
A lock (
) or https:// means you've safely
connected to the .gov website. Share sensitive
information only on official, secure websites.
Comparison of changes in prey catch attempt (PrCA) over time for adult females (purple; left) and juveniles (green; right). Dashed lines indicate estimates from the fixed part of GAMMs and thin constant lines the individual random effects