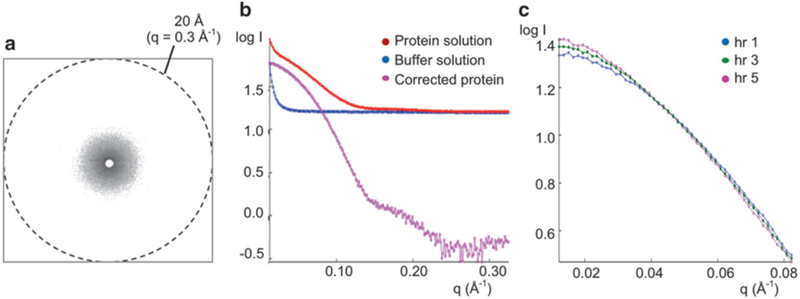
Fig. 1.

Small-angle X-ray scattering data collection and processing. (a) Typical X-ray scattering pattern of a protein solution. The scattering intensities are radially averaged to yield a 1-D scattering curve of I(q) vs. q. (b) 1-D SAXS scattering curves for a protein solution, a buffer solution, and corrected protein. The SAXS data are collected for protein and buffer solutions. The scattering intensity of the buffer solution is then subtracted from that of the protein solution to obtain the corrected scattering intensity for the target protein. This corrected curve is then used for data analysis. (c) Example of radiation damage. Protein samples were exposed to X-rays for five consecutive hours and data recorded at 1 h intervals. Only the first, third, and fifth hours are shown for clarity. Increased exposure times led to an increase in log I(q) at the lowest q regions, indicative of protein aggregation due to radiation damage
