Fig. 2.

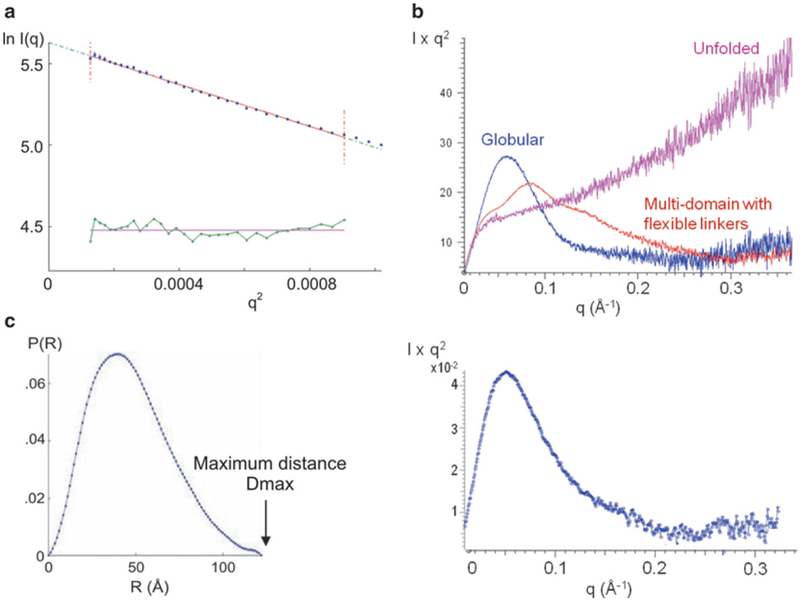
SAXS data analysis. (a) Guinier plot, ln[I(q)] vs. q2. The fit of the Guinier equation is shown in red. The bottom green line shows the residual. The radius of gyration RG is calculated from the slope of the Guinier plot. (B) Kratky plot, I(q)q2 vs. q. Top. Examples of a globular protein, an unfolded protein, and a multi-domain protein with flexible linkers are shown (from [4]). Bottom: The Kratky plot for this particular protein (dengue NS5) shows a profile typical of a globular protein [5]. (c) Pair-wise distance distribution function P(r). The radius of gyration RG calculated from the P(r) for the dengue NS5 is 35.6 ± 1 Å, which is in a good agreement with the value of 35.1 ± 1 Å obtained from the Guinier plot [5]. The shape of the P(r) for the protein has an asymmetric peak with a tailing profile for the higher distances, indicative of a rather elongated shape
