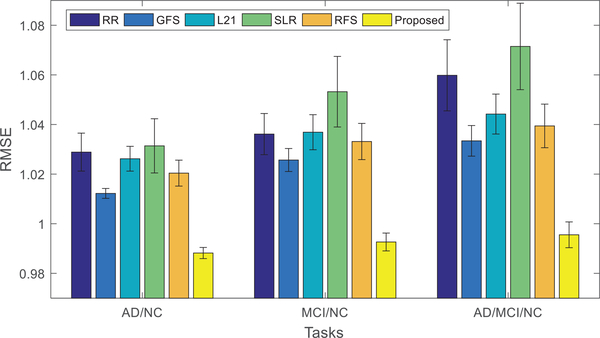
Fig. 3.
Performance comparison using different methods and different subsets of data (i.e., task or disease cohort combination). The mean of the root mean square errors (RMSE) obtained from the experiments of each method is plotted. Lower RMSE indicates better performance. In addition, the standard deviations of RMSE are also shown in the figure as error bars.

