figure:

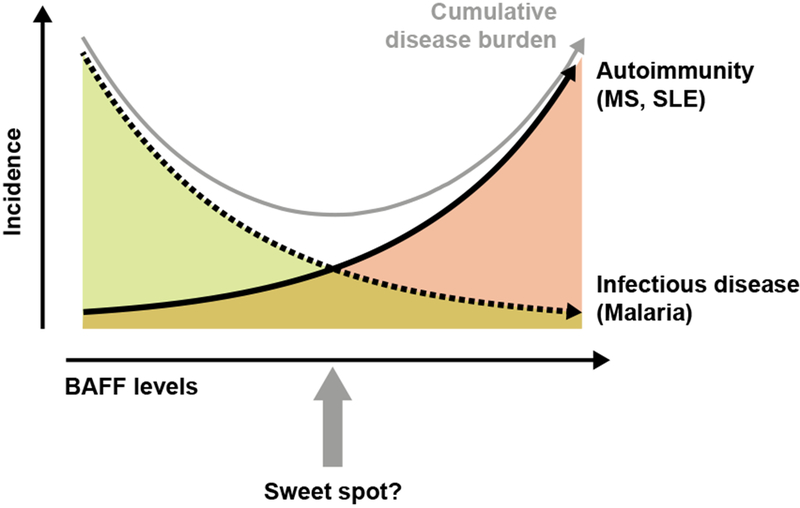
When disease incidence in a population is plotted against levels of BAFF, the area under the curve represents the disease burden of a given disease entity as a function of BAFF levels. In this issue of The New England Journal of Medicine, Cucca and colleagues provide evidence for an association of increased BAFF levels with an increased susceptibility for MS and SLE in the Sardinian population and show that the genetic variants of BAFF that lead to increased BAFF levels were selected because they result in a greater protection from Malaria infection. Increased levels of BAFF would result in a decrease in the disease burden due to Malaria but an increase in the disease burden due to autoimmune diseases. Thus, there might be an “optimum” BAFF level (sweet spot), at which the cumulative primitive function of both incidence curves reaches a minimum (gray curve).
