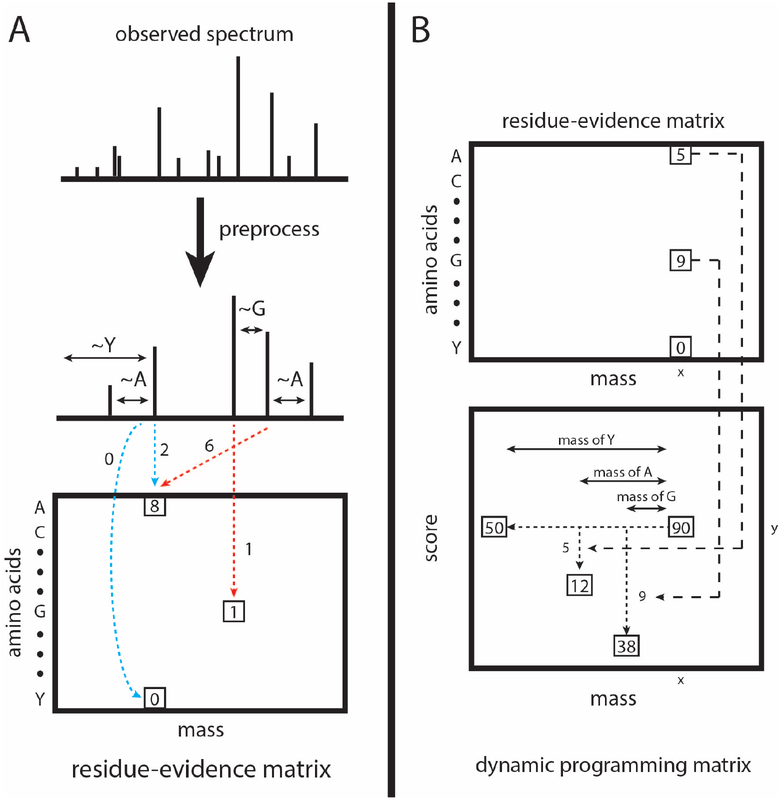
Figure 2:
Calculation and calibration of the res-ev score. (A) The observed spectrum is preprocessed similarly as for XCorr. For each possible pair of peaks, it is determined whether the pair gives evidence that a peptide fragment ends with a particular amino acid. The evidence for each amino acid being terminal at each nominal mass bin is accrued in a matrix of residue evidence. Blue dotted lines represent evidence that is accrued when the peaks are assumed to be 1+ b ions. Red dotted lines represent evidence accrued when the peaks are assumed to be 1+ y ions. However, evidence is added to the residue-evidence matrix indexed by its corresponding charge 1+ b ion, so that all evidence related to a particular fragmentation is aggregated together. (B) Each cell in the dynamic programming matrix represents the number of possible peptide sequences, given the spectrum, with a particular mass and score. In our example, there are 90 possible peptide sequences with a mass of x and a score of y. Dynamic programming is carried out by, for each cell, summing the values of ~20 previously calculated cells (corresponding to the number of amino acids). In our mock example, the cell labeled 90 was the result from summing the cells labeled 50, 12, and 38. We choose the cells to be summed as follows. Assume that a peptide fragment ends in a glycine. From the cell labeled 90, we find the mass bin that corresponds to the mass after subtracting the mass of glycine (x - 57). From the residue-evidence matrix, we know how much evidence there is that a peptide fragment with mass x ends in a glycine (in this case, 9). Therefore, we subtract 9 from the score (y - 9). This leads up to the cell that is labeled 38. Therefore, we know that 38 peptide fragment sequences could result in a specific score and mass. This process is done for the remaining amino acids. In our diagram, we only show the process for 3 amino acids.

