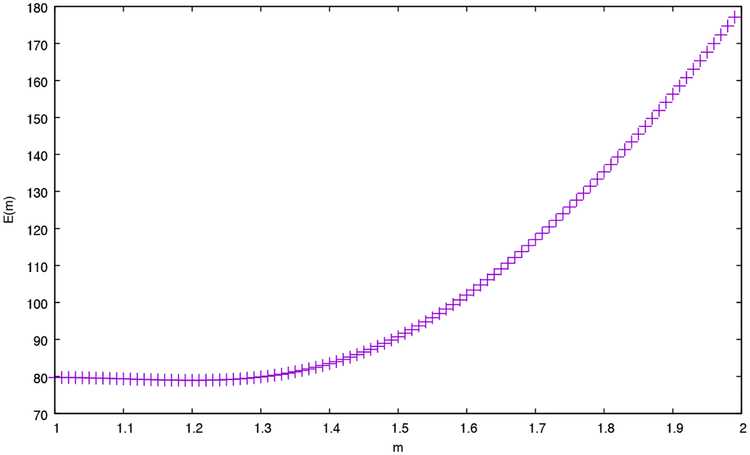
Figure 3:
Using decoys to set the m parameter. The figure plots the error E(m) (Equation 12) as a function of the parameter m. To generate this plot, the Plasmodium data set was analyzed using both XCorr p-value and res-ev p-value. All decoy p-values for each spectrum were retained, yielding a set of 197,029 pairs of p-values. Values of E(m) were computed for m = 1.00, 1.01, … , 1.99. The minimum error value occurs around m = 1.20.

