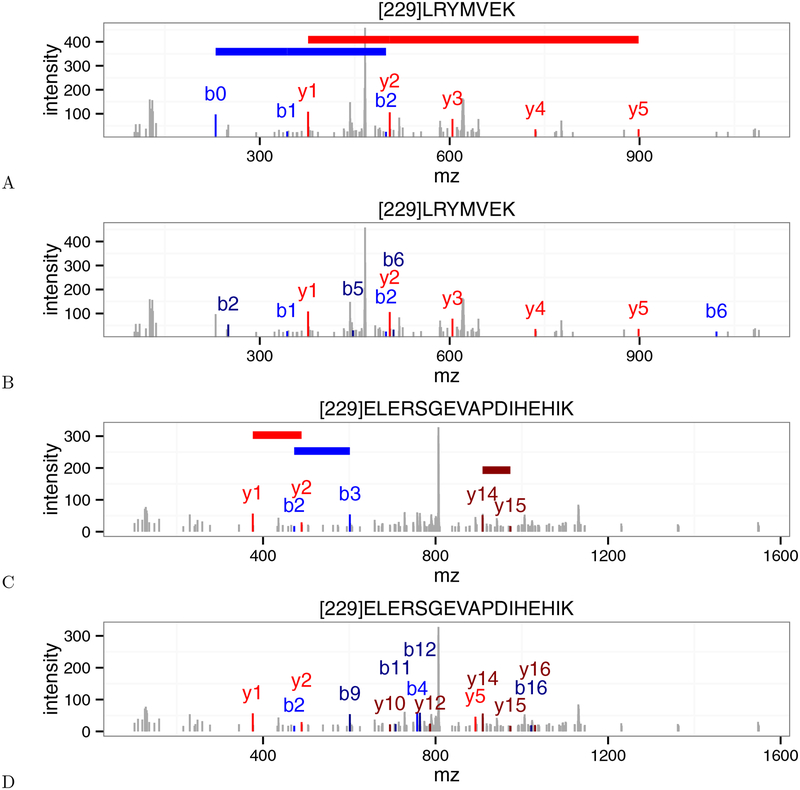
Figure 5:
Disagreements between the XCorr score and the residue-evidence score. (A) An annotated Plasmodium spectrum (scan 5468) that received a low (i.e., good) p-value from the residue-evidence score. Colored horizontal lines indicate the locations of peak-pairs that contribute to the residue-evidence score. Note that the mass of [229] corresponds to the tandem mass tag modification. (B) Same as (A), but annotated using XCorr. This scan received a high XCorr p-value. (C) Plasmodium scan 11156, annotated with res-ev, with a high p-value. (D) Same as (C), but annotated using XCorr, with a low p-value. In each panel, peaks colored in blue, dark blue, red, and dark red represent b+1, b+2, y+1, y+2 ions, respectively.

