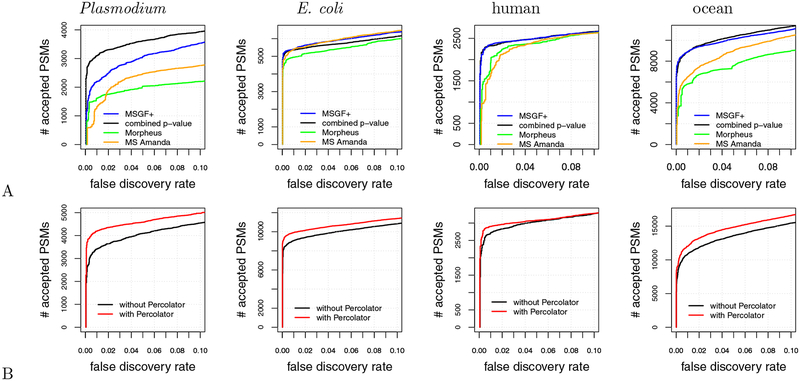
Figure 7:
Comparison with existing methods. (A) The panel plots, for four datasets, the number of PSMs accepted as a function of FDR threshold for four different database search methods: MS-GF+, combined p-value, MS-Amanda, and Morpheus. (B) Similar to (A), but the two series correspond to the combined p-value with and without post-processing via Percolator.

