Figure 1.

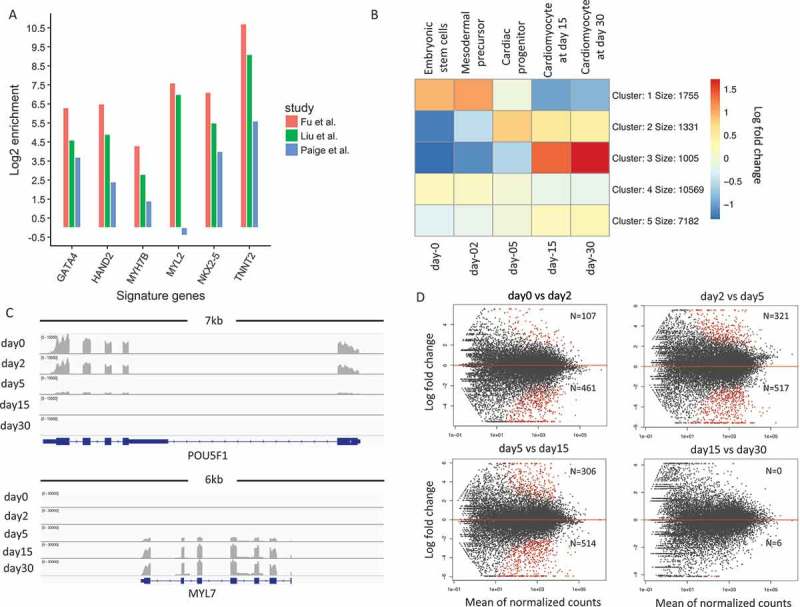
Patterns of gene expression changes during cardiogenesis.(a). Comparison of signature gene expression enrichments for cardiomyocytes between our study and Paige et al./Liu et al. The y-axis represents the log 2 fold change between expression values of signature genes and average expression values of all genes. (b). K-means clustering of normalized gene expression values for samples among the five developmental stages. The color in the heatmap represents the log 2 fold change of expression values. The red color represents a higher expression value than average expression across samples, while the blue color represents the opposite. Text on the left of heatmap indicates the enriched gene ontology terms for each cluster of genes. (c). Genome browser view of RNA-Seq data for POU5F1 gene and MYL7 gene. Each track shows the expression profile for a different stage. (d). MA-plot of differential expressed genes for neighboring stage comparisons (A VS B). The number N shows the number of up and down-regulated genes. The number above the red line represents the number of DEGs that is up-regulated in A.
