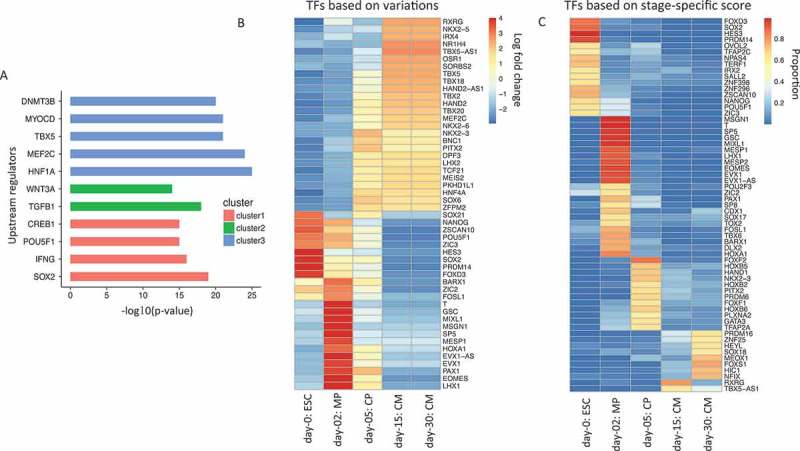
Figure 2.

Identification of upstream regulators, most varied and stage-specific transcription factors (TFs) during cardiogenesis. (a). Ingenuity pathway software analysis identifies statistical significant upstream regulators for the cluster of genes showed in Figure 1(b). (b). Heatmap for top 50 TFs showing the largest expression variations from ESCs to cardiomyocytes. Each column represents a different sample, and each row represents a different gene. The color in the heatmap again represents the log 2 fold change of normalized expression values. (c). Heatmap for stage-specific TFs from ESCs to cardiomyocytes. The color in the heatmap represents the proportion of expression value for that sample to the sum of all samples.
