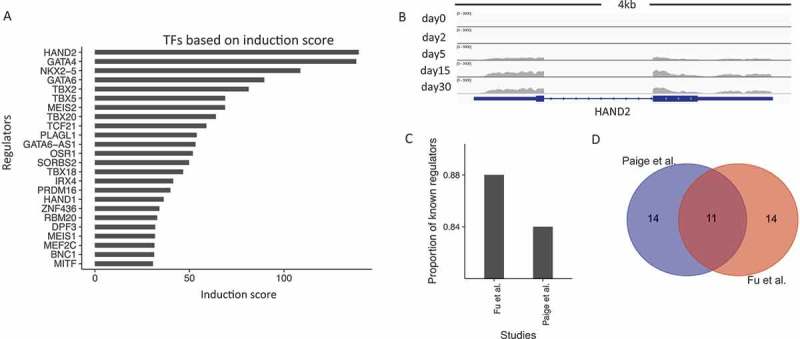
Figure 3.

Expression-based induction score captures a large fraction of well-known cardiac regulators. (a). Bar-plot of the top 25 regulators (y-axis) ranked by their induction scores (x-axis). (b). Genome browser view of RNA-Seq data for HAND2. (c). The proportion of known cardiac regulators in the top 25 hits based on the ranking score by our study and by Paige et al. (d). Venn-diagram of the top 25 regulators identified by our ranking approach and by Paige et al.
