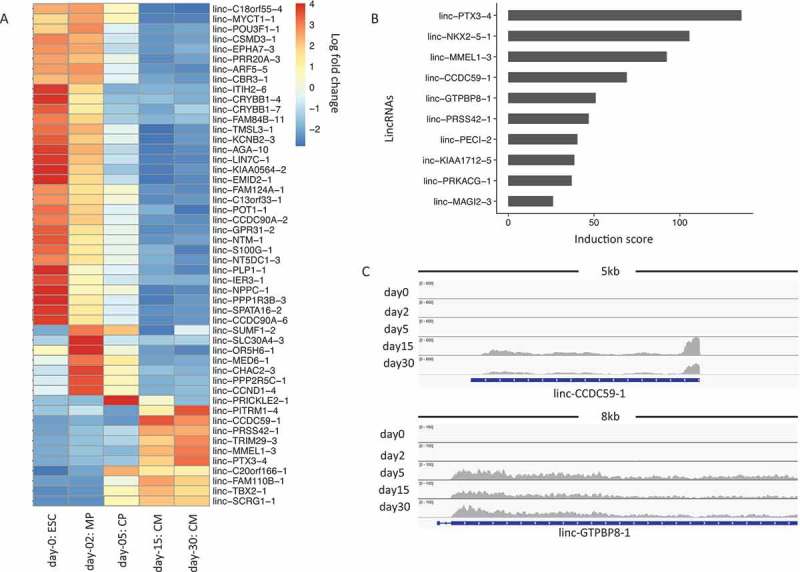
Figure 4.

LincRNA expression changes during cardiogenesis. (a). Heatmap for top 50 lincRNAs showing the largest variations from ESCs to cardiomyocytes. The color in the heatmap represents the log 2 fold change of normalized lincRNA expressions. Each row represents a lincRNA name. (b). Bar plot of lincRNAs that show an induction score of 10 or higher. (c). Genome browser view of RNA-Seq data for lincRNAs of linc-CCDC59-1 and linc-GTPBP8-1 during cardiogenesis.
