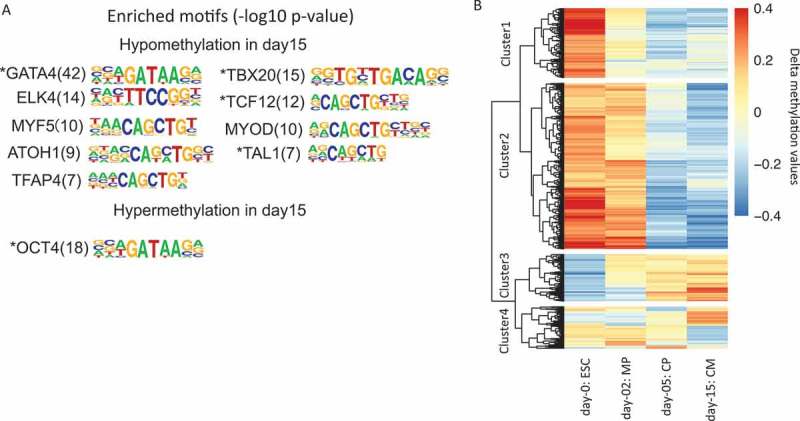
Figure 5.

RRBS-based DNA methylation changes during cardiogenesis. (a). Enriched transcription factors and their motif sequences found in DMSs’ neighboring 200 bp regions. The number in the bracket shows the – log10 P value of the statistical significance for motif discovery. (b). Hierarchical clustering of RRBS fragments that show at least 0.2 delta methylation changes compared to average methylation levels across samples. The color in the heatmap represents the delta methylation value. The red color represents hyper methylation while blue color represents hypo methylation.
