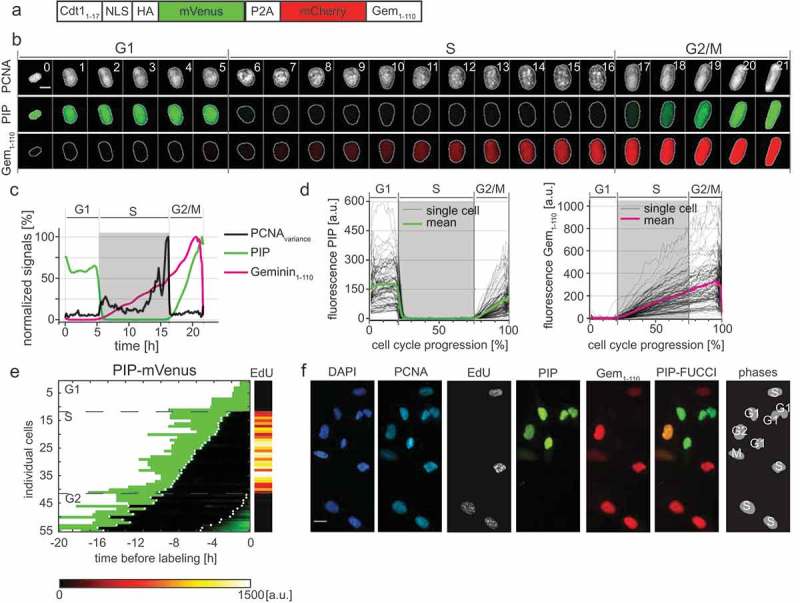
Figure 3.

PIP-FUCCI is a precise cell cycle phase indicator. a) Schematic of the PIP-FUCCI dual reporter expression construct. Cdt11–17 = human Cdt1 amino acids 1-17 including the PIP degron, NLS = SV40 nuclear localization signal, HA = epitope tag, P2A = self-cleaving peptide, Gem1-110 = human Geminin amino acids 1-110 including both the D box and KEN motif. b) Selected images from wide field time-lapse imaging of a U2OS cell expressing mTurq2-PCNA and the PIP-FUCCI reporters PIP-mVenus and mCherry-Gem1-110. One frame from each hour beginning after cytokinesis is shown with the nucleus outlined; numbers in the upper strip indicate hours since mitosis. Scale bar 10 µm. c) Quantification of PCNA variance (black line) and PIP-FUCCI reporter fluorescence signals (green and magenta lines) from the cell in 3B. d) Dynamics of the PIP-mVenus reporter (left) and the mCherry-Gem1-110 (right) throughout the cell cycle. Gray lines are 100 randomly selected cells and heavy colored lines are the mean signal in the population (n = 125). S phase boundaries were determined by PCNA localization and are indicated with a gray rectangle; warping as in Figure 1(d). e) Heat map of the signal intensity values of PIP-mVenus (green) in 55 asynchronously growing cells before EdU labeling. EdU intensity value (right) of the 55 cells. White dots indicate the beginning and end of S phase annotated manually based on the PCNA signal. f) Micrographs of selected asynchronously growing U2OS cells before EdU labeling (PCNA, PIP, and Gem1-110) and after labeling (DAPI and EdU). The cell cycle phase of each cell is indicated in the most right panel. Scale bar, 25 µm.
