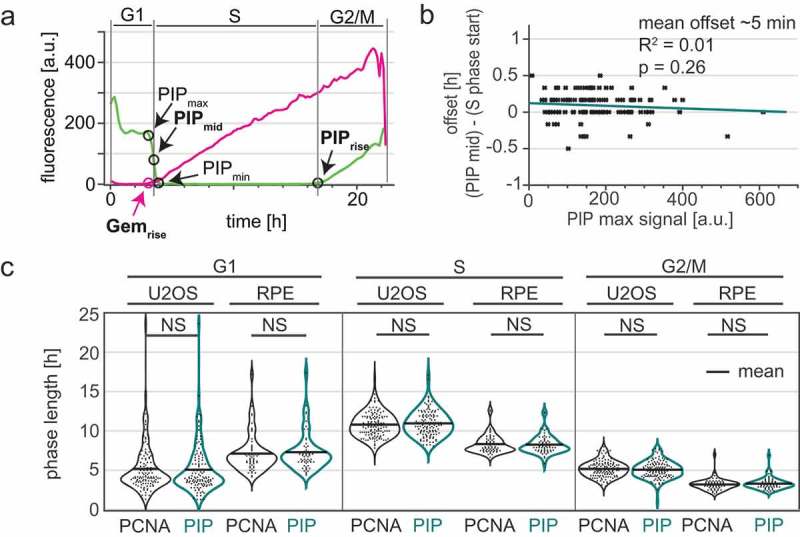
Figure 4.

The PIP degron fusion protein precisely marks the G1/S and S/G2 transitions. a) One annotated example of traces from a single U2OS cell expressing PIP-mVenus (green) and mCherry-Gem1-110 (magenta). “PIPmid” is the time at which 50% of the maximum PIP-mVenus signal is lost ((“PIPmax” – “PIPmin”)/2) and is used to mark the beginning of S phase. Details of trace annotations are described in Materials and Methods. b) Correlation of PIP-mVenus PIPmax level with the offset between the beginning of S phase (determined by PCNA foci) and PIPmid in individual U2OS cells. Teal line represents the best fit linear model (n = 121). c) Distributions of cell cycle phase lengths measured by PCNA foci and PIP-mVenus dynamics in U2OS (n = 121) and RPE-hTert (n = 57) cells. No differences between the pairs of distributions were detected according to Kolmogorov-Smirnov test (p > 0.05). Black line indicates mean.
