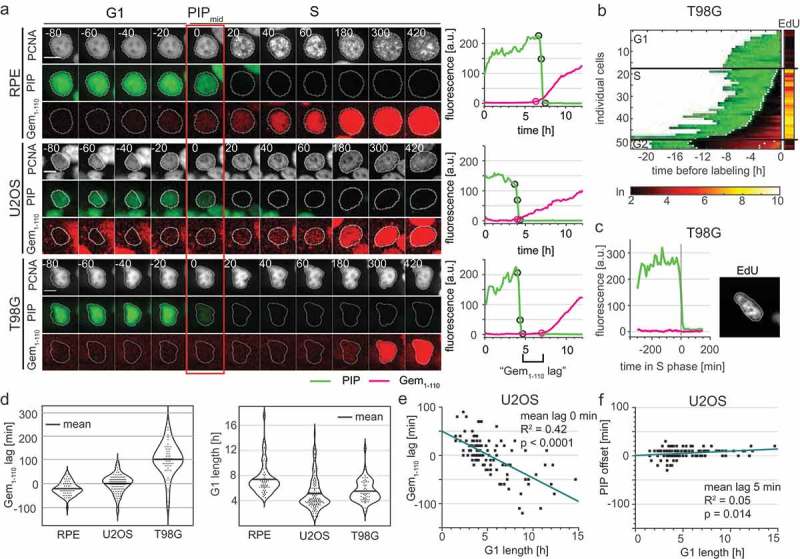
Figure 6.

Variable APCCdh1 reporter accumulation relative to the start of S phase in different cell lines. a) (Left) Micrographs of a single representative cell of RPE-hTert, U2OS, and T98G cells expressing PIP-FUCCI and mTurq2-PCNA; the red rectangle marks the frame of PIPmid. (Right) Quantification of PIP-FUCCI reporter intensities in the cells shown at left. PIPmax, PIPmid, PIPmin, and Gemrise are indicated by circles. Delay of Gemrise relative to both PIPmid is defined as “Gem1-110 lag”, and is an indicator of the relative timing of APCCdh1 inactivation and S phase onset. b) Heat map of the signal intensity values of PIP-mVenus (green) and Geminin1-110 (red) in asynchronously growing T98G cells before EdU labeling in the final 30 minutes. EdU intensity value (right, logarithmic scale) of the individual cells. White dots indicate the points of degradation and re-accumulation of PIP-mVenus. c) PIP-FUCCI signals from a single T98G cell before EdU labeling in early S phase. Cells were labelled with EdU for the final 30 minutes of the experiment. d) (Left) Quantification of the mean Gem1-110 lag in untreated, asynchronous RPE-hTert (n = 56), U2OS (n = 120), and T98G cells (n = 51). Gemrise that precedes S phase onset has a negative value. (Right) Distributions of G1 length in different cell lines as measured by PIP-mVenus dynamics (RPE-hTert n = 56, U2OS n = 120, T98G n = 51). e) Correlation between G1 length and Gem1-110 lag in untreated asynchronous U2OS cells (n = 120). f) Correlation between G1 length and PIP-mVenus S phase offset in U2OS cells (n = 120).
