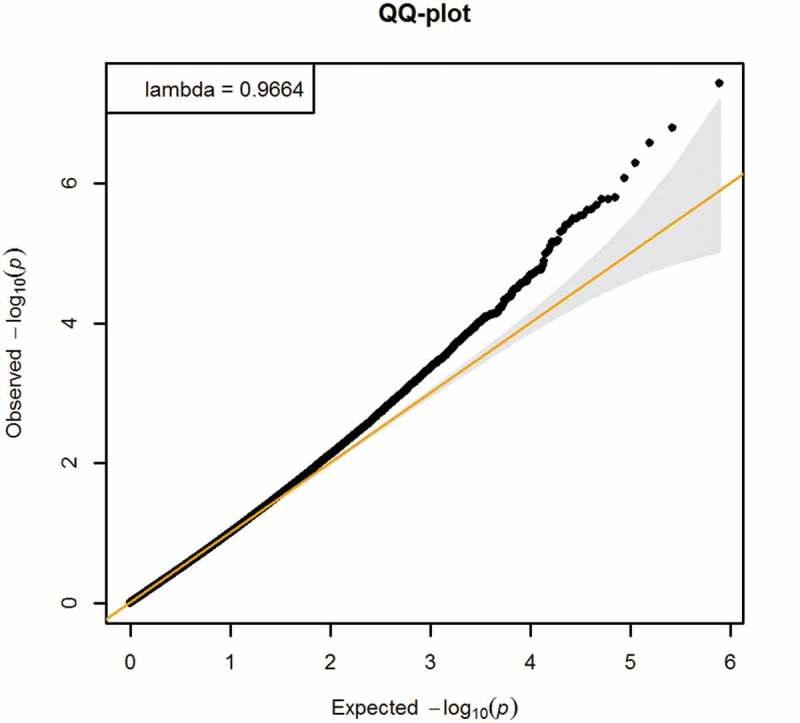
Figure 2.

QQ-plot of EWAS of BMI z-score in mid-childhood and DNA methylation in mid-childhood (Adjusted for age at blood draw for DNA methylation, cell type proportion, child sex, maternal education and maternal smoking during pregnancy).

QQ-plot of EWAS of BMI z-score in mid-childhood and DNA methylation in mid-childhood (Adjusted for age at blood draw for DNA methylation, cell type proportion, child sex, maternal education and maternal smoking during pregnancy).