
Figure 1.
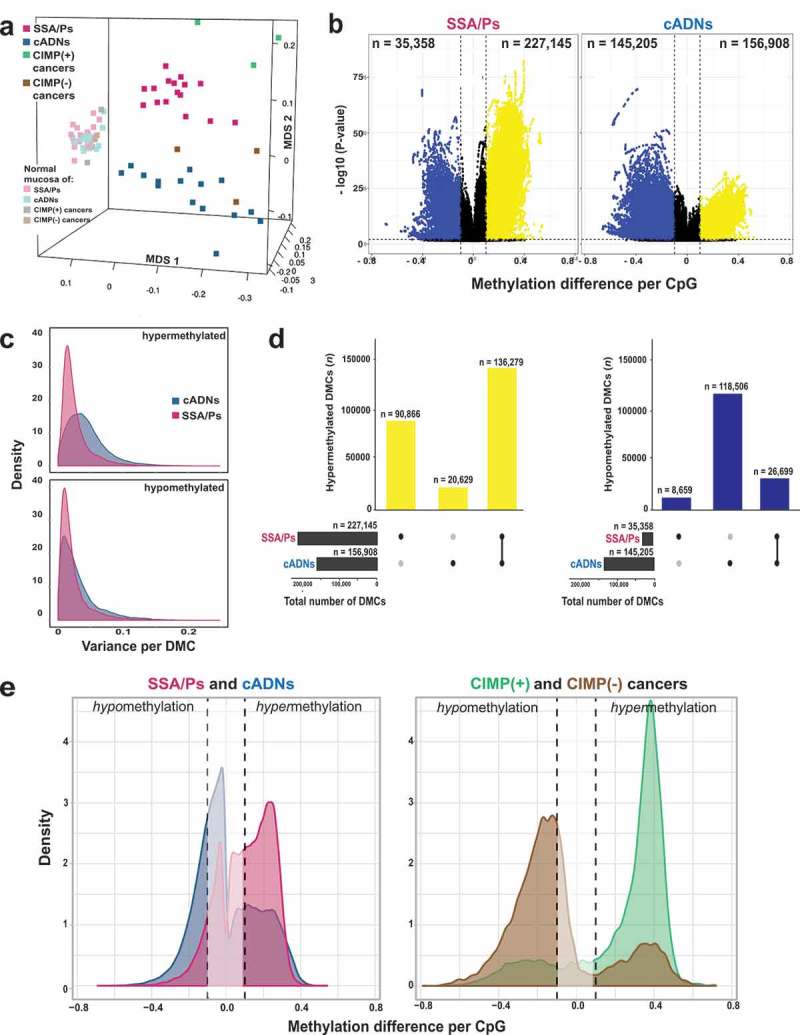
Differentially methylated cytosines (DMCs) in precancerous and cancerous colon lesions. a. MDS plot (Supplementary Experimental Procedures) of DNA methylation levels in SSA/Ps (n = 16); cADNs (n = 15); CIMP(+) cancers (n = 3); CIMP(-) cancers (n = 3); and matched samples of normal mucosa for each lesion. b. Volcano plots showing the magnitude (x axis) and statistical significance (y axis) of the differential methylation observed at DMCs identified in SSA/Ps and cADNs. X-axis: The magnitude of differential methylation was calculated as the M:T ratio (no. methylated reads/total no. reads) for the tumor sample minus M:T ratio for matched normal-tissue control. Black dots: DMCs with absolute methylation differences of <0.1 and P-values > 0.01. Yellow and blue dots: highly significant (P-value < 0.01) DMCs (hypermethylated and hypomethylated, respectively). c. Density plot showing variance at the hypermethylated (top) and hypomethylated (bottom) DMCs (yellow and blue dots of panel B, respectively). d. UpSet plots showing hypermethylated (left) and hypomethylated (right) DMC sets in SSA/Ps and cADNs and their overlaps. Exact numbers of lesion-specific (•) and shared (•-•) DMCs appear above the bars. e. Overlaid density plots showing the distributions of hypo- and hypermethylated DMCs in SSA/Ps and cADNs (left), and CIMP(+) and CIMP(-) cancers (right). X-axis as described in panel B.