Figure 4.

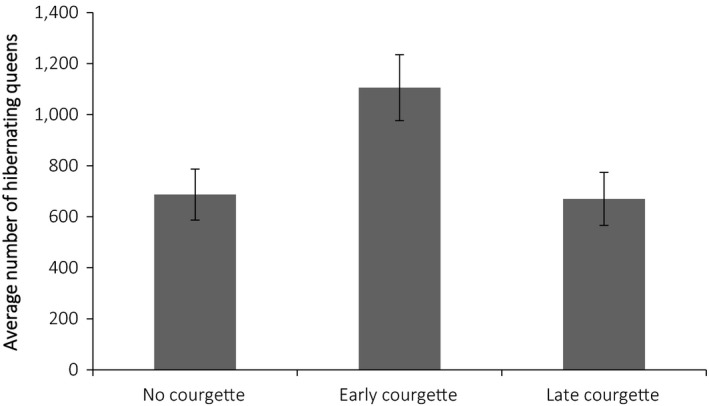
Average number of hibernating queens ± SE on the last day of year (year 11) for each cropping scenario. Data were averaged across the 10 repeated runs and 14 study sites

Average number of hibernating queens ± SE on the last day of year (year 11) for each cropping scenario. Data were averaged across the 10 repeated runs and 14 study sites