Figure 5.

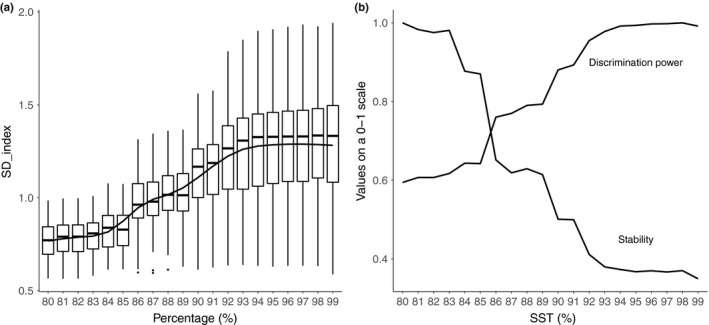
Standard deviations from the IdxOTU values (SD_index) of samples within each of the 100 randomization steps were calculated and plotted against the associated SST (a). The mean (reflective of the discrimination power of the index) and the standard deviation (reflective of the stability of the index) of the SD_index as a function of the SST, normalized to a scale ranging from 0 to 1 (b)
