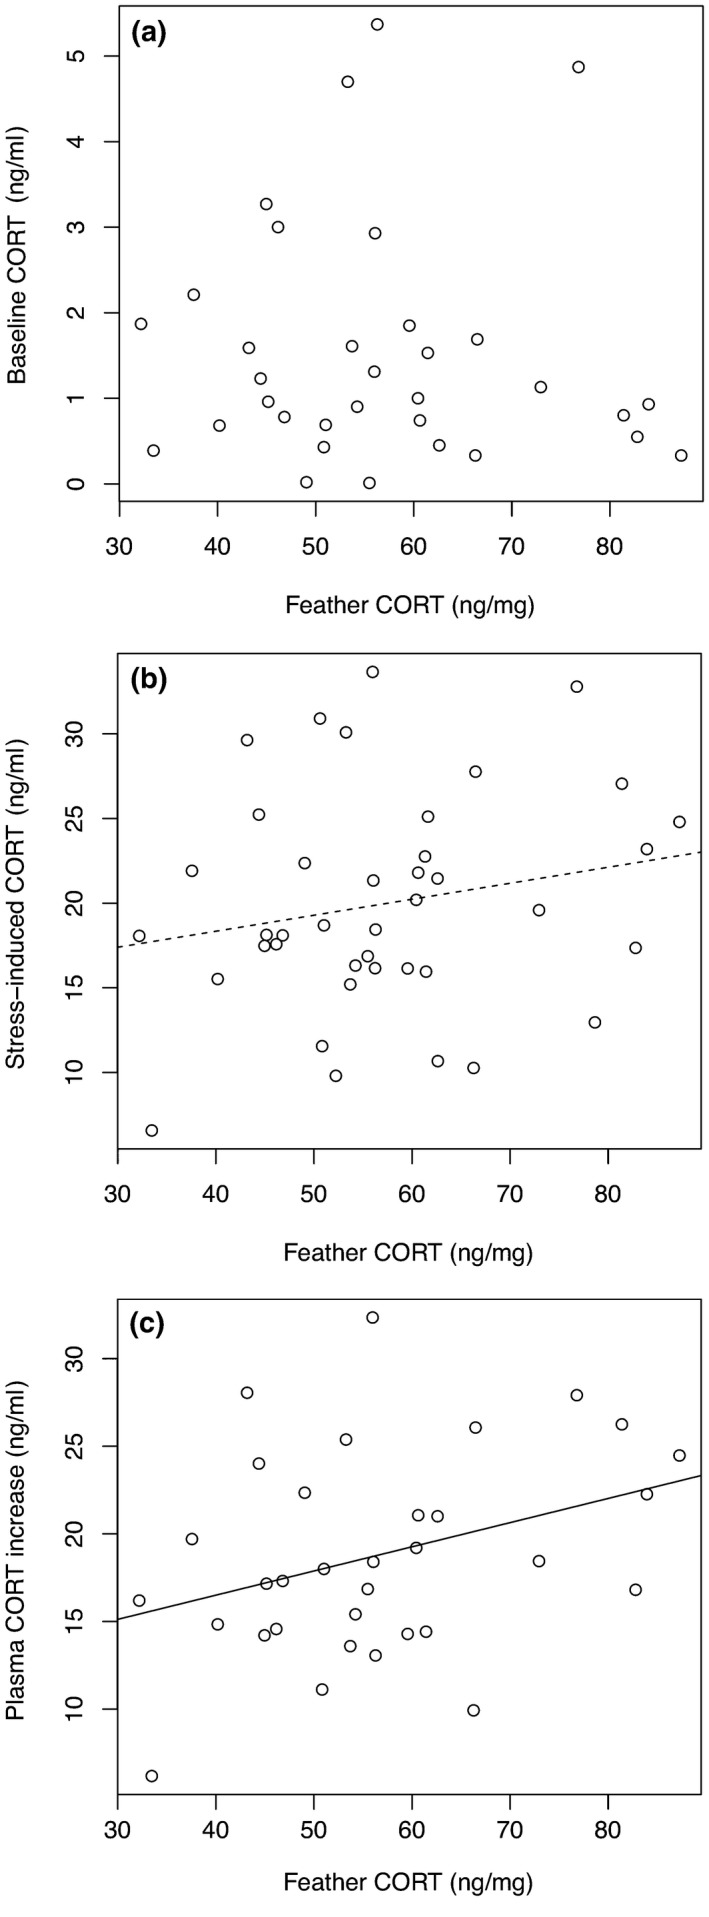
Figure 3.

Relationship between feather CORT levels expressed in ng/mg and (a) baseline CORT level, (b) stress‐induced CORT level, and (c) increase in plasma CORT in juvenile sparrows. The dotted line represents a marginal and non‐significant relationship (p < 0.10); the solid line represents a significant relationship (p < 0.05)
